Image Decompression and Azimuthal Integration on the GPU#
This tutorial explains how to accelerate azimuthal integration by optimizing the critical bottleneck: data transfer to the GPU.
For this tutorial, a recent version of silx is required (newer than Fall 2022, available in release 1.2 or later).
Credits:
Thomas Vincent (ESRF): HDF5 direct chunk read and Jupyter-Slurm integration
Jon Wright (ESRF): Initial prototype of Bitshuffle-LZ4 decompression on the GPU
Pierre Paleo (ESRF): Support with GPU-related challenges
Note: A capable GPU is required for this tutorial, with OpenCL properly configured!
The example used here is the same as the multithreading tutorial: 4096 frames from Eiger_4M.
%matplotlib inline
# use `widget` for better user experience; `inline` is for documentation generation
import sys, os, collections, struct, time, resource
import numpy, pyFAI
import h5py, hdf5plugin
from matplotlib.pyplot import subplots
import bitshuffle
import pyopencl.array as cla
import silx
from silx.opencl import ocl
from silx.opencl.codec.bitshuffle_lz4 import BitshuffleLz4
start_time = time.time()
ocl
OpenCL devices:
[0] NVIDIA CUDA: (0,0) NVIDIA RTX A5000, (0,1) Quadro P2200
[1] Portable Computing Language: (1,0) cpu-haswell-AMD Ryzen Threadripper PRO 3975WX 32-Cores
[2] Intel(R) OpenCL: (2,0) AMD Ryzen Threadripper PRO 3975WX 32-Cores
#Here we select the OpenCL device
target = (0,0)
Setting Up the Environment#
This is a purely virtual experiment. We will simulate an Eiger 4M detector with data integrated over 1000 bins. These parameters can be adjusted.
Random data are generated with small values that compress well, keeping the file size reasonably small. The speed of the drive where the file is stored will likely have a significant impact!
det = pyFAI.detector_factory("eiger_4M")
shape = det.shape
dtype = numpy.dtype("uint32")
filename = "/tmp/big.h5"
nbins = 1000
cmp = hdf5plugin.Bitshuffle()
hdf5plugin.get_config().registered_filters
{'bshuf': '/users/kieffer/.venv/py314/lib/python3.14/site-packages/hdf5plugin/plugins/libh5bshuf.so',
 'blosc': '/users/kieffer/.venv/py314/lib/python3.14/site-packages/hdf5plugin/plugins/libh5blosc.so',
 'blosc2': '/users/kieffer/.venv/py314/lib/python3.14/site-packages/hdf5plugin/plugins/libh5blosc2.so',
 'bzip2': '/users/kieffer/.venv/py314/lib/python3.14/site-packages/hdf5plugin/plugins/libh5bzip2.so',
 'fcidecomp': '/users/kieffer/.venv/py314/lib/python3.14/site-packages/hdf5plugin/plugins/libh5fcidecomp.so',
 'lz4': '/users/kieffer/.venv/py314/lib/python3.14/site-packages/hdf5plugin/plugins/libh5lz4.so',
 'sperr': '/users/kieffer/.venv/py314/lib/python3.14/site-packages/hdf5plugin/plugins/libh5sperr.so',
 'sz': '/users/kieffer/.venv/py314/lib/python3.14/site-packages/hdf5plugin/plugins/libh5sz.so',
 'sz3': '/users/kieffer/.venv/py314/lib/python3.14/site-packages/hdf5plugin/plugins/libh5sz3.so',
 'zfp': '/users/kieffer/.venv/py314/lib/python3.14/site-packages/hdf5plugin/plugins/libh5zfp.so',
 'zstd': '/users/kieffer/.venv/py314/lib/python3.14/site-packages/hdf5plugin/plugins/libh5zstd.so'}
mem_bytes = os.sysconf('SC_PAGE_SIZE') * os.sysconf('SC_PHYS_PAGES')
target_bytes = 64 * 1<<30  # 64GB
print(f"Number of frames the computer can host in memory: {mem_bytes/(numpy.prod(shape)*dtype.itemsize):.3f}")
if os.environ.get('SLURM_MEM_PER_NODE'):
    print(f"Number of frames the computer can host in memory with SLURM restrictions: {int(os.environ['SLURM_MEM_PER_NODE'])*(1<<20)/(numpy.prod(shape)*dtype.itemsize):.3f}")
elif mem_bytes>target_bytes:
    print("Limit process to 64GB memory, i.e. ~ 3800 frames")
    soft, hard = resource.getrlimit(resource.RLIMIT_AS)
    resource.setrlimit(resource.RLIMIT_AS, (target_bytes, target_bytes))
Number of frames the computer can host in memory: 30144.536
Limit process to 64GB memory, i.e. ~ 3800 frames
#The computer being limited to 64G of RAM, the number of frames actually possible is 3800.
nbframes = 4096 # slightly larger than the maximum achievable ! Such a dataset should not host in memory.
#Prepare a frame with little count so that it compresses well
geo = {"detector": det,
"wavelength": 1e-10,
"rot3":0} #work around a bug https://github.com/silx-kit/pyFAI/pull/1749
ai = pyFAI.load(geo)
omega = ai.solidAngleArray()
q = numpy.arange(15)
img = ai.calcfrom1d(q, 100/(1+q*q))
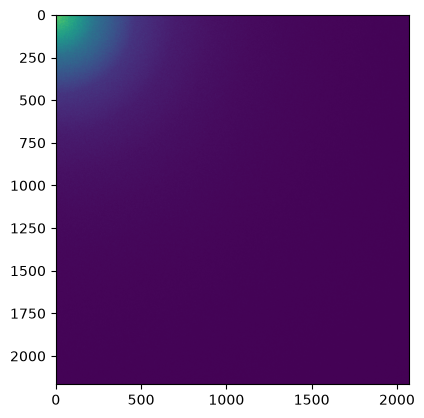
frame = numpy.random.poisson(img).astype(dtype)
# display the image
fig,ax = subplots()
ax.imshow(frame)
<matplotlib.image.AxesImage at 0x7f9fd247c2f0>
print("Performances of the different algorithms for azimuthal integration of Eiger 4M image on the CPU")
for algo in ("histogram", "csc", "csr"):
    print(f"Using algorithm {algo:10s}:", end=" ")
    %timeit ai.integrate1d(img, nbins, method=("full", algo, "cython"))
print("Performances of the different algorithms for azimuthal integration of Eiger 4M image on the GPU")
print(f"Using algorithm {algo:10s}:", end=" ")
%timeit ai.integrate1d(img, nbins, method=("full", algo, "opencl", target))
Performances of the different algorithms for azimuthal integration of Eiger 4M image on the CPU
Using algorithm histogram :
611 ms ± 3.94 ms per loop (mean ± std. dev. of 7 runs, 1 loop each)
Using algorithm csc       :
43 ms ± 124 μs per loop (mean ± std. dev. of 7 runs, 1 loop each)
Using algorithm csr       :
38.3 ms ± 3.62 ms per loop (mean ± std. dev. of 7 runs, 1 loop each)
Performances of the different algorithms for azimuthal integration of Eiger 4M image on the GPU
Using algorithm csr       :
4.95 ms ± 33.1 μs per loop (mean ± std. dev. of 7 runs, 100 loops each)
Note: The full pixel splitting is time consuming and handicaps the histogram algorithm while both sparse-matrix methods are much faster since they cache this calculation in the sparse matrix.
On the Power9 computer the CPU is much slower than the GPU !
# How is the time spend when integrating on GPU ?
res0 = ai.integrate1d(frame, nbins, method=("full", "csr", "opencl", target))
engine = ai.engines[res0.method].engine
engine.events = []
engine.set_profiling(True)
omega_crc = engine.on_device["solidangle"]
%timeit engine.integrate_ng(img, solidangle=omega, solidangle_checksum=omega_crc)
print("\n".join(engine.log_profile(stats=True)))
engine.set_profiling(False)
engine.events = []
4.8 ms ± 17.5 μs per loop (mean ± std. dev. of 7 runs, 100 loops each)

OpenCL kernel profiling statistics in milliseconds for: OCL_CSR_Integrator
                                       Kernel name (count):      min   median      max     mean      std
                                   copy H->D image (  811):    1.447    1.469    2.498    1.472    0.039
                                         memset_ng (  811):    0.010    0.012    0.032    0.012    0.001
                                     corrections4a (  811):    0.179    0.181    0.184    0.181    0.001
                                    csr_integrate4 (  811):    0.393    0.396    0.399    0.396    0.001
                                  copy D->H avgint (  811):    0.002    0.002    0.002    0.002    0.000
                                     copy D->H std (  811):    0.002    0.002    0.002    0.002    0.000
                                     copy D->H sem (  811):    0.001    0.001    0.001    0.001    0.000
                                 copy D->H merged8 (  811):    0.002    0.002    0.003    0.002    0.000
________________________________________________________________________________
                       Total OpenCL execution time        : 1677.542ms
Note: Most of the time is spent in the transfer from the CPU to the GPU.
%%timeit -r1 -n1 -o -q
#Saving of a HDF5 file with many frames ...

# if not os.path.exists(filename):
with h5py.File(filename, "w") as h:
    ds = h.create_dataset("data", shape=(nbframes,)+shape, chunks=(1,)+shape, dtype=dtype, **cmp)
    for i in range(nbframes):
        ds[i] = frame + i%500 #Each frame has a different value to prevent caching effects
<TimeitResult : 1min 9s ± 0 ns per loop (mean ± std. dev. of 1 run, 1 loop each)>
timing_write = _
size=os.stat(filename).st_size
print(f"File size {size/(1024**3):.3f} GB with a compression ratio of {nbframes*numpy.prod(shape)*dtype.itemsize/size:.3f}x")
print(f"Write speed: {nbframes*numpy.prod(shape)*dtype.itemsize/(1e6*timing_write.best):.3f} MB/s of uncompressed data, or {nbframes/timing_write.best:.3f} fps.")
File size 9.214 GB with a compression ratio of 7.429x
Write speed: 1055.841 MB/s of uncompressed data, or 58.845 fps.
%%timeit -r1 -n1 -o -q
#Reading all frames and decompressing them
buffer = numpy.zeros(shape, dtype=dtype)
with h5py.File(filename, "r") as h:
    ds = h["data"]
    for i in range(nbframes):
        ds.read_direct(buffer, numpy.s_[i,:,:], numpy.s_[:,:])
<TimeitResult : 42.9 s ± 0 ns per loop (mean ± std. dev. of 1 run, 1 loop each)>
timing_read1 = _
print(f"Read speed: {nbframes*numpy.prod(shape)*dtype.itemsize/(1e6*timing_read1.best):.3f} MB/s of uncompressed data, or {nbframes/timing_read1.best:.3f} fps.")
Read speed: 1714.966 MB/s of uncompressed data, or 95.580 fps.
# Time for decompressing one frame:
chunk = bitshuffle.compress_lz4(frame,0)
print(f"Compression ratio: {frame.nbytes/len(chunk):.3f}x")
timing_decompress = %timeit -o bitshuffle.decompress_lz4(chunk, frame.shape, frame.dtype, 0)
print(f"Decompression speed: {1/timing_decompress.best:.3f} fps")
Compression ratio: 9.098x
The slowest run took 7.34 times longer than the fastest. This could mean that an intermediate result is being cached.
2.13 ms ± 2.44 ms per loop (mean ± std. dev. of 7 runs, 100 loops each)
Decompression speed: 904.167 fps
%%timeit -r1 -n1 -o -q
#Reading all frames without decompressing them
with h5py.File(filename, "r") as h:
    ds = h["data"]
    for i in range(ds.id.get_num_chunks()):
        filter_mask, chunk = ds.id.read_direct_chunk(ds.id.get_chunk_info(i).chunk_offset)
<TimeitResult : 1.32 s ± 0 ns per loop (mean ± std. dev. of 1 run, 1 loop each)>
timing_read2 = _
print(f"Read speed: {size/(1e6*timing_read2.best):.3f} MB/s of compressed data.")
print(f"HDF5 read speed (without decompression): {nbframes/timing_read2.best:.3f} fps.")
print(f"HDF5 read speed (with decompression, theoritical): {nbframes/(timing_read2.best+timing_decompress.best*nbframes):.3f} fps.")
Read speed: 7492.703 MB/s of compressed data.
HDF5 read speed (without decompression): 3102.106 fps.
HDF5 read speed (with decompression, theoritical): 700.107 fps.
Preparing the Azimuthal Integrator#
To unleash the full performance of the azimuthal integrator, specifically its ability to handle GPU arrays, the OpenCL integrator must be extracted from AzimuthalIntegrator. The integrator used here employs sparse matrix multiplication with a CSR (Compressed Sparse Row) representation, optimized to run on the GPU.
res0 = ai.integrate1d(frame, nbins, method=("full", "csr", "opencl", target))
engine = ai.engines[res0.method].engine
#This is how the engine works. First send the image on the GPU:

timing_integration_from_mem = %timeit -r3 -o engine.integrate_ng(frame, solidangle=omega, solidangle_checksum=omega_crc)

frame_d = cla.to_device(engine.queue, frame)
omega_crc = engine.on_device["solidangle"]

res1 = engine.integrate_ng(frame_d, solidangle=omega, solidangle_checksum=omega_crc)
assert numpy.allclose(res0.intensity, res1.intensity)  # validates the equivalence of both approaches:
timing_integration = %timeit -r3 -o engine.integrate_ng(frame_d, solidangle=omega, solidangle_checksum=omega_crc)
print(f"The maximum achievable integration speed on this device is {1/timing_integration.best:.3f} fps when data are in the GPU memory,"
      f"\nbut only {1/timing_integration_from_mem.best:.3f} fps when data are still in the CPU memory !")
2.07 ms ± 3.62 μs per loop (mean ± std. dev. of 3 runs, 100 loops each)
829 μs ± 89.7 ns per loop (mean ± std. dev. of 3 runs, 1,000 loops each)
The maximum achievable integration speed on this device is 1206.426 fps when data are in the GPU memory,
but only 484.056 fps when data are still in the CPU memory !
timimg_sum_theo = timing_integration.best + timing_read2.best/nbframes + timing_integration_from_mem.best
timimg_sum_prac = timing_read1.best/nbframes + timing_integration_from_mem.best
print(f"The maximum theoritical throughput considering reading, decompression and integration is {1/timimg_sum_theo:.3f} fps.\n"
     f"But in practice, most people achieve at best {1/timimg_sum_prac:.3f} fps, "
      "partially due to a poor implementation of decompression in HDF5.")
The maximum theoritical throughput considering reading, decompression and integration is 310.836 fps.
But in practice, most people achieve at best 79.819 fps, partially due to a poor implementation of decompression in HDF5.
Summary:
Read speed: 2908 fps
Read + decompress: 96/406 fps
Read + decompress + integrate: 80/312 fps.
Using the decompression on the GPU#
This feature requires silx 1.2 !
silx.version
'3.0.2-a0'
# Read one chunk
with h5py.File(filename, "r") as h:
    ds = h["data"]
    i=0
    filter_mask, chunk = ds.id.read_direct_chunk(ds.id.get_chunk_info(i).chunk_offset)
gpu_decompressor = BitshuffleLz4(len(chunk), frame.size, dtype=frame.dtype, ctx=engine.ctx)
#Tune the decompressor for the fastest speed:
best = numpy.finfo("float32").max, None
for i in range(0, 11):
    j = 1<<i
    print(f"Workgroup size {j:4d} : ", end=" ")
    res = %timeit -o gpu_decompressor.decompress(chunk, wg=j)
    if res.best<best[0]:
        best = (res.best, j)

print(f"\nBest performances ({best[0]:.3e}s) obtained with WG={best[1]}")
gpu_decompressor.block_size = best[1]

print(f"\nDecompression of data on the GPU occures at {1/best[0]:.3f} fps "
      f"while it is {1/timing_decompress.best:.3f} fps when performed on the CPU.")
Workgroup size 1 :
10.7 ms ± 36 μs per loop (mean ± std. dev. of 7 runs, 100 loops each)
Workgroup size    2 :
5.52 ms ± 10.9 μs per loop (mean ± std. dev. of 7 runs, 100 loops each)
Workgroup size    4 :
2.93 ms ± 4.66 μs per loop (mean ± std. dev. of 7 runs, 100 loops each)
Workgroup size    8 :
1.59 ms ± 1.84 μs per loop (mean ± std. dev. of 7 runs, 1,000 loops each)
Workgroup size   16 :
932 μs ± 431 ns per loop (mean ± std. dev. of 7 runs, 1,000 loops each)
Workgroup size   32 :
606 μs ± 1.05 μs per loop (mean ± std. dev. of 7 runs, 1,000 loops each)
Workgroup size   64 :
455 μs ± 1.84 μs per loop (mean ± std. dev. of 7 runs, 1,000 loops each)
Workgroup size  128 :
391 μs ± 338 ns per loop (mean ± std. dev. of 7 runs, 1,000 loops each)
Workgroup size  256 :
389 μs ± 766 ns per loop (mean ± std. dev. of 7 runs, 1,000 loops each)
Workgroup size  512 :
454 μs ± 417 ns per loop (mean ± std. dev. of 7 runs, 1,000 loops each)
Workgroup size 1024 :
690 μs ± 1.96 μs per loop (mean ± std. dev. of 7 runs, 1,000 loops each)

Best performances (3.882e-04s) obtained with WG=256

Decompression of data on the GPU occures at 2575.744 fps while it is 904.167 fps when performed on the CPU.
#Tune the integrator for the fastest speed:

def new_engine(engine, wg):
    return engine.__class__((engine._data, engine._indices, engine._indptr),
                              engine.size, empty=engine.empty, unit=engine.unit,
                              bin_centers=engine.bin_centers, azim_centers = engine.azim_centers,
                              ctx=engine.ctx, block_size=wg)

best = (numpy.finfo("float32").max, None)
for i in range(0, 11):
    j = 1<<i
    print(f"Workgroup size {j:3d} : ", end=" ")
    ne = new_engine(engine, j)
    ne.integrate_ng(frame_d, solidangle=omega, solidangle_checksum=omega_crc)
    res = %timeit -o ne.integrate_ng(frame_d, solidangle=omega, solidangle_checksum=omega_crc)
    if res.best<best[0]:
        best = (res.best, j)

print(f"\nBest performances ({best[0]:.3e}s) obtained with WG={best[1]}")
engine = new_engine(engine, best[1])
print("With data on the CPU:")
timing_integrate_cpu = %timeit -o engine.integrate_ng(frame, solidangle=omega, solidangle_checksum=omega_crc)
Workgroup size 1 :
8.82 ms ± 699 ns per loop (mean ± std. dev. of 7 runs, 100 loops each)
Workgroup size   2 :
5.54 ms ± 2.28 μs per loop (mean ± std. dev. of 7 runs, 100 loops each)
Workgroup size   4 :
3.26 ms ± 406 ns per loop (mean ± std. dev. of 7 runs, 100 loops each)
Workgroup size   8 :
2.08 ms ± 399 ns per loop (mean ± std. dev. of 7 runs, 100 loops each)
Workgroup size  16 :
1.24 ms ± 1.24 μs per loop (mean ± std. dev. of 7 runs, 1,000 loops each)
Workgroup size  32 :
843 μs ± 792 ns per loop (mean ± std. dev. of 7 runs, 1,000 loops each)
Workgroup size  64 :
733 μs ± 374 ns per loop (mean ± std. dev. of 7 runs, 1,000 loops each)
Workgroup size 128 :
734 μs ± 131 ns per loop (mean ± std. dev. of 7 runs, 1,000 loops each)
Workgroup size 256 :
709 μs ± 418 ns per loop (mean ± std. dev. of 7 runs, 1,000 loops each)
Workgroup size 512 :
678 μs ± 204 ns per loop (mean ± std. dev. of 7 runs, 1,000 loops each)
Workgroup size 1024 :
682 μs ± 208 ns per loop (mean ± std. dev. of 7 runs, 1,000 loops each)

Best performances (6.776e-04s) obtained with WG=512
With data on the CPU:
1.92 ms ± 2.14 μs per loop (mean ± std. dev. of 7 runs, 1,000 loops each)
print(f"Azimuthal integration of data on the GPU occures at {1/best[0]:.3f} fps\n"
      f"while it is {1/timing_integrate_cpu.best:.3f} fps when data comes from the CPU.")
Azimuthal integration of data on the GPU occures at 1475.750 fps
while it is 522.908 fps when data comes from the CPU.
#Build a pipeline with decompression and integration on the GPU:
%timeit engine.integrate_ng(gpu_decompressor(chunk), solidangle=omega, solidangle_checksum=omega_crc)
1.09 ms ± 1.56 μs per loop (mean ± std. dev. of 7 runs, 1,000 loops each)
result = numpy.empty((nbframes, nbins), dtype=numpy.float32)
%%timeit -r1 -n1 -o -q
# Process a complete stack:
with h5py.File(filename, "r") as h:
    ds = h["data"]
    for i in range(ds.id.get_num_chunks()):
        filter_mask, chunk = ds.id.read_direct_chunk(ds.id.get_chunk_info(i).chunk_offset)
        result[i] = engine.integrate_ng(gpu_decompressor(chunk), solidangle=omega, solidangle_checksum=omega_crc).intensity
<TimeitResult : 7.35 s ± 0 ns per loop (mean ± std. dev. of 1 run, 1 loop each)>
timing_process_gpu = _
print(f"Processing speed when decompression occures on GPU: {nbframes/timing_process_gpu.best:.3f} fps "
      f"which is better than theoritical speed by {timimg_sum_theo*nbframes/timing_process_gpu.best:.3f}x.\n"
     f"It is much better than the actual speed measured by {timimg_sum_prac*nbframes/timing_process_gpu.best:.3f}x.")
Processing speed when decompression occures on GPU: 556.937 fps which is better than theoritical speed by 1.792x.
It is much better than the actual speed measured by 6.977x.
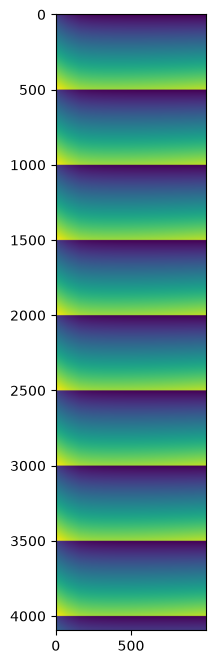
Display some results#
Since the input data were all synthetic and similar, no great science is expected from this… but one can ensure each frame differs slightly from the neighbors with a pattern of 500 frames.
fig,ax = subplots(figsize=(8,8))
ax.imshow(result)
<matplotlib.image.AxesImage at 0x7f9fd008dd10>
Conclusion#
Bitshuffle-LZ4 data decompression can be offloaded to the GPU, which is especially appealing when downstream processing also requires GPU computing like azimuthal integration.
The procedure is simpler than the multi-threading approach: no queues, no threads, it just requires a GPU properly set up.
The performance measured on a (not so recent) NVIDIA A5000 on a fast CPU (4.5 GHz) provides a 5x speedup!
Those performances can be further parallelized using multiprocessing if needed (see the other tutorial in this section).
Conclusion#
Bitshuffle-LZ4 data decompression can be offloaded to the GPU, which is especially appealing when downstream processing also requires GPU computing, such as azimuthal integration.
The procedure is simpler than the multi-threading approach: no queues, no threads—just a GPU properly set up.
Performance measured on a (somewhat dated) NVIDIA A5000 paired with a fast CPU (4.5 GHz) provides a 6× speedup!
This performance can be further improved through multiprocessing if needed (see the other tutorial in this section).
print(f"Total processing time: {time.time()-start_time:.3f} s")
Total processing time: 293.176 s