
items: Plot primitives#
This package provides classes that describes PlotWidget content.
Instances of those classes are returned by PlotWidget methods that give
access to its content such as PlotWidget.getCurve(), PlotWidget.getImage().
Item#
All plot primitives inherits from Item as a common ground:
- class Item[source]#
Bases:
QObjectDescription of an item of the plot
- sigItemChanged#
Signal emitted when the item has changed.
It provides a flag describing which property of the item has changed. See
ItemChangedTypefor flags description.
- getPlot()[source]#
Returns the ~silx.gui.plot.PlotWidget this item belongs to.
- Return type:
Union[PlotWidget,None]
- getBounds()[source]#
Returns the bounding box of this item in data coordinates
- Returns:
(xmin, xmax, ymin, ymax) or None
- Return type:
4-tuple of float or None
- setVisible(visible)[source]#
Set visibility of item.
- Parameters:
visible (bool) – True to display it, False otherwise
- setName(name)[source]#
Set the name of the item which is used as legend.
- Parameters:
name (str) – New name of the item
- Raises:
RuntimeError – If item belongs to a PlotWidget.
- getInfo(copy=True)[source]#
Returns the info associated to this item
- Parameters:
copy (bool) – True to get a deepcopy, False otherwise.
- getVisibleBounds()[source]#
Returns visible bounds of the item bounding box in the plot area.
- Returns:
(xmin, xmax, ymin, ymax) in data coordinates of the visible area or None if item is not visible in the plot area.
- Return type:
tuple[float,float,float,float] |None
- pick(x, y)[source]#
Run picking test on this item
- Parameters:
x (float) – The x pixel coord where to pick.
y (float) – The y pixel coord where to pick.
- Returns:
None if not picked, else the picked position information
- Return type:
Union[None,PickingResult]
Curve#
- class Curve[source]#
Description of a curve
- getAlpha()#
Returns the opacity of the item
- Return type:
float in [0, 1.]
- getColor()#
Returns the RGBA color of the item
- Return type:
4-tuple of float in [0, 1] or array of colors
- getData(copy=True, displayed=False)#
Returns the x, y values of the curve points and xerror, yerror
- Parameters:
copy (bool) – True (Default) to get a copy, False to use internal representation (do not modify!)
displayed (bool) – True to only get curve points that are displayed in the plot. Note: If plot has log scale, negative points are not displayed. Negative errors are set to 0.
- Returns:
(x, y, xerror, yerror)
- Return type:
4-tuple of numpy.ndarray
- getHighlightedStyle()#
Returns the highlighted style in use
- Return type:
- getLineStyle()#
Return the type of the line
Type of line:
- ' '  no line
- '-'  solid line
- '--' dashed line
- '-.' dash-dot line
- ':'  dotted line
- (offset, (dash pattern))
- Return type:
Union[str,tuple[Union[float,int],None],tuple[Union[float,int],tuple[Union[float,int],Union[float,int]]],tuple[Union[float,int],tuple[Union[float,int],Union[float,int],Union[float,int],Union[float,int]]]]
- getLineWidth()#
Return the curve line width in pixels
- Return type:
float
- getSymbol()#
Return the point marker type.
Marker type:
- 'o' circle
- '.' point
- ',' pixel
- '+' cross
- 'x' x-cross
- 'd' diamond
- 's' square
- Return type:
str
- getSymbolSize(copy=True)#
Return the marker size in points.
- Parameters:
copy (
bool)- Return type:
float
- getXData(copy=True)#
Returns the x coordinates of the data points
- Parameters:
copy – True (Default) to get a copy, False to use internal representation (do not modify!)
- Return type:
numpy.ndarray
- getXErrorData(copy=True)#
Returns the x error of the points
- Parameters:
copy – True (Default) to get a copy, False to use internal representation (do not modify!)
- Return type:
numpy.ndarray, float or None
- getXLabel()#
Return the X axis label associated to this curve
- Return type:
str or None
- getYAxis()#
Returns the Y axis this curve belongs to.
Either ‘left’ or ‘right’.
- Return type:
str
- getYData(copy=True)#
Returns the y coordinates of the data points
- Parameters:
copy – True (Default) to get a copy, False to use internal representation (do not modify!)
- Return type:
numpy.ndarray
- getYErrorData(copy=True)#
Returns the y error of the points
- Parameters:
copy – True (Default) to get a copy, False to use internal representation (do not modify!)
- Return type:
numpy.ndarray, float or None
- getYLabel()#
Return the Y axis label associated to this curve
- Return type:
str or None
- isFill()#
Returns whether the item is filled or not.
- Return type:
bool
- isHighlighted()#
Returns True if curve is highlighted.
- Return type:
bool
- setAlpha(alpha)#
Set the opacity of the item
Note
If the colormap already has some transparency, this alpha adds additional transparency. The alpha channel of the colormap is multiplied by this value.
- Parameters:
alpha (float) – Opacity of the item, between 0 (full transparency) and 1. (full opacity)
- setColor(color, copy=True)#
Set item color
- Parameters:
color (str ("#RRGGBB") or (npoints, 4) unsigned byte array or one of the predefined color names defined in colors.py) – color(s) to be used
copy (bool) – True (Default) to get a copy, False to use internal representation (do not modify!)
- setFill(fill)#
Set whether to fill the item or not.
- Parameters:
fill (bool)
- setHighlighted(highlighted)#
Set the highlight state of the curve
- Parameters:
highlighted (bool)
- setHighlightedStyle(style)#
Set the style to use for highlighting
- Parameters:
style (CurveStyle) – New style to use
- setLineStyle(style)#
Set the style of the curve line.
See
getLineStyle().- Parameters:
style (
Union[str,tuple[Union[float,int],None],tuple[Union[float,int],tuple[Union[float,int],Union[float,int]]],tuple[Union[float,int],tuple[Union[float,int],Union[float,int],Union[float,int],Union[float,int]]],None]) – Line style
- setLineWidth(width)#
Set the width in pixel of the curve line
See
getLineWidth().- Parameters:
width (
float)
- setSymbol(symbol)#
Set the marker type
See
getSymbol().- Parameters:
symbol (str) – Marker type or marker name
- setSymbolSize(size, copy=True)#
Set the marker size in points.
See
getSymbolSize().- Parameters:
size (
float|None)copy (
bool)
- setYAxis(yaxis)#
Set the Y axis this curve belongs to.
- Parameters:
yaxis (str) – ‘left’ or ‘right’
- getCurrentStyle()[source]#
Returns the current curve style.
Curve style depends on curve highlighting
- Return type:
- setData(x, y, xerror=None, yerror=None, baseline=None, copy=True)[source]#
Set the data of the curve.
- Parameters:
x (
ndarray) – The data corresponding to the x coordinates.y (
ndarray) – The data corresponding to the y coordinates.xerror (
ndarray|None) – Values with the uncertainties on the x values If it is an array, it can either be a 1D array of same length as the data or a 2D array with 2 rows of same length as the data: row 0 for positive errors, row 1 for negative errors.yerror (
ndarray|None) – Values with the uncertainties on the y values.baseline (
ndarray|float|None) – curve baselinecopy (
bool) – True make a copy of the data (default), False to use provided arrays.
- class CurveStyle(color=None, linestyle=None, linewidth=None, symbol=None, symbolsize=None, gapcolor=None)[source]#
Object storing the style of a curve.
Set a value to None to use the default
- Parameters:
color (
tuple[float,float,float,float] |None) – Colorlinestyle (
Union[str,tuple[Union[float,int],None],tuple[Union[float,int],tuple[Union[float,int],Union[float,int]]],tuple[Union[float,int],tuple[Union[float,int],Union[float,int],Union[float,int],Union[float,int]]],None]) – Style of the linelinewidth (
float|None) – Width of the linesymbol (
str|None) – Symbol for markerssymbolsize (
float|None) – Size of the markersgapcolor (
tuple[float,float,float,float] |None) – Color of gaps of dashed line
- getColor(copy=True)[source]#
Returns the color or None if not set.
- Parameters:
copy (
bool) – True to get a copy (default), False to get internal representation (do not modify!)- Return type:
tuple[float,float,float,float] |None
- getLineStyle()[source]#
Return the type of the line or None if not set.
Type of line:
- ' '  no line
- '-'  solid line
- '--' dashed line
- '-.' dash-dot line
- ':'  dotted line
- (offset, (dash pattern))
- Return type:
Union[str,tuple[Union[float,int],None],tuple[Union[float,int],tuple[Union[float,int],Union[float,int]]],tuple[Union[float,int],tuple[Union[float,int],Union[float,int],Union[float,int],Union[float,int]]],None]
- getLineWidth()[source]#
Return the curve line width in pixels or None if not set.
- Return type:
float|None
Images#
- class ImageData[source]#
Description of a data image with a colormap
- getRgbaImageData(copy=True)[source]#
Get the displayed RGB(A) image
- Return type:
ndarray- Returns:
Array of uint8 of shape (height, width, 4)
- Parameters:
copy (
bool)
- getAlternativeImageData(copy=True)[source]#
Get the optional RGBA image that is displayed instead of the data
- Parameters:
copy (
bool) – True (Default) to get a copy, False to use internal representation (do not modify!)- Return type:
ndarray|None
- getAlpha()#
Returns the opacity of the item
- Return type:
float in [0, 1.]
- getColormap()#
Return the used colormap
- getData(copy=True)#
Returns the image data
- Parameters:
copy (
bool) – True (Default) to get a copy, False to use internal representation (do not modify!)- Return type:
ndarray
- getOrigin()#
Returns the offset from origin at which to display the image.
- Return type:
tuple[float,float]
- getScale()#
Returns the scale of the image in data coordinates.
- Return type:
tuple[float,float]
- isDraggable()#
Returns true if image is draggable
- Return type:
bool
- setAlpha(alpha)#
Set the opacity of the item
Note
If the colormap already has some transparency, this alpha adds additional transparency. The alpha channel of the colormap is multiplied by this value.
- Parameters:
alpha (float) – Opacity of the item, between 0 (full transparency) and 1. (full opacity)
- setColormap(colormap)#
Set the colormap of this item
- Parameters:
colormap (silx.gui.colors.Colormap) – colormap description
- setOrigin(origin)#
Set the offset from origin at which to display the image.
- Parameters:
origin (
tuple[float,float]) – (ox, oy) Offset from origin
- setScale(scale)#
Set the scale of the image
- Parameters:
scale (
tuple[float,float]) – (sx, sy) Scale of the image
- class ImageRgba[source]#
Description of an RGB(A) image
- getRgbaImageData(copy=True)[source]#
Get the displayed RGB(A) image
- Return type:
ndarray- Returns:
numpy.ndarray of uint8 of shape (height, width, 4)
- Parameters:
copy (
bool)
- getAlpha()#
Returns the opacity of the item
- Return type:
float in [0, 1.]
- getData(copy=True)#
Returns the image data
- Parameters:
copy (
bool) – True (Default) to get a copy, False to use internal representation (do not modify!)- Return type:
ndarray
- getOrigin()#
Returns the offset from origin at which to display the image.
- Return type:
tuple[float,float]
- getScale()#
Returns the scale of the image in data coordinates.
- Return type:
tuple[float,float]
- isDraggable()#
Returns true if image is draggable
- Return type:
bool
- setAlpha(alpha)#
Set the opacity of the item
Note
If the colormap already has some transparency, this alpha adds additional transparency. The alpha channel of the colormap is multiplied by this value.
- Parameters:
alpha (float) – Opacity of the item, between 0 (full transparency) and 1. (full opacity)
- setOrigin(origin)#
Set the offset from origin at which to display the image.
- Parameters:
origin (
tuple[float,float]) – (ox, oy) Offset from origin
- setScale(scale)#
Set the scale of the image
- Parameters:
scale (
tuple[float,float]) – (sx, sy) Scale of the image
Scatter#
- class Scatter[source]#
Description of a scatter
- getValueData(copy=True)[source]#
Returns the value assigned to the scatter data points.
- Parameters:
copy (
bool) – True (Default) to get a copy, False to use internal representation (do not modify!)- Return type:
ndarray
- getAlpha()#
Returns the opacity of the item
- Return type:
float in [0, 1.]
- getColormap()#
Return the used colormap
- getData(copy=True, displayed=False)[source]#
Returns the x, y coordinates and the value of the data points
- Parameters:
copy (
bool) – True (Default) to get a copy, False to use internal representation (do not modify!)displayed (
bool) – True to only get curve points that are displayed in the plot. Default: False. Note: If plot has log scale, negative points are not displayed.
- Return type:
tuple[ndarray,ndarray,ndarray,ndarray,ndarray]- Returns:
(x, y, value, xerror, yerror)
- getSymbol()#
Return the point marker type.
Marker type:
- 'o' circle
- '.' point
- ',' pixel
- '+' cross
- 'x' x-cross
- 'd' diamond
- 's' square
- Return type:
str
- getSymbolSize(copy=True)#
Return the marker size in points.
- Parameters:
copy (
bool)- Return type:
float
- getXData(copy=True)#
Returns the x coordinates of the data points
- Parameters:
copy – True (Default) to get a copy, False to use internal representation (do not modify!)
- Return type:
numpy.ndarray
- getXErrorData(copy=True)#
Returns the x error of the points
- Parameters:
copy – True (Default) to get a copy, False to use internal representation (do not modify!)
- Return type:
numpy.ndarray, float or None
- getYData(copy=True)#
Returns the y coordinates of the data points
- Parameters:
copy – True (Default) to get a copy, False to use internal representation (do not modify!)
- Return type:
numpy.ndarray
- getYErrorData(copy=True)#
Returns the y error of the points
- Parameters:
copy – True (Default) to get a copy, False to use internal representation (do not modify!)
- Return type:
numpy.ndarray, float or None
- setAlpha(alpha)#
Set the opacity of the item
Note
If the colormap already has some transparency, this alpha adds additional transparency. The alpha channel of the colormap is multiplied by this value.
- Parameters:
alpha (float) – Opacity of the item, between 0 (full transparency) and 1. (full opacity)
- setColormap(colormap)#
Set the colormap of this item
- Parameters:
colormap (silx.gui.colors.Colormap) – colormap description
- setSymbol(symbol)#
Set the marker type
See
getSymbol().- Parameters:
symbol (str) – Marker type or marker name
- setSymbolSize(size, copy=True)#
Set the marker size in points.
See
getSymbolSize().- Parameters:
size (
float|None)copy (
bool)
- setData(x, y, value, xerror=None, yerror=None, alpha=None, copy=True)[source]#
Set the data of the scatter.
- Parameters:
x (
ndarray) – The data corresponding to the x coordinates.y (
ndarray) – The data corresponding to the y coordinates.value (
ndarray) – The data corresponding to the value of the data points.xerror (
float|ndarray|float32|None) – Values with the uncertainties on the x values If it is an array, it can either be a 1D array of same length as the data or a 2D array with 2 rows of same length as the data: row 0 for lower errors, row 1 for upper errors.yerror (
float|ndarray|float32|None) – Values with the uncertainties on the y valuesalpha (
float|ndarray|float32|None) – Values with the transparency (between 0 and 1)copy (
bool) – True make a copy of the data (default), False to use provided arrays.
Histogram#
- class Histogram[source]#
Description of an histogram
- getValueData(copy=True)[source]#
The values of the histogram
- Parameters:
copy – True (Default) to get a copy, False to use internal representation (do not modify!)
- Returns:
The values of the histogram
- Return type:
numpy.ndarray
- getBinEdgesData(copy=True)[source]#
The bin edges of the histogram (number of histogram values + 1)
- Parameters:
copy – True (Default) to get a copy, False to use internal representation (do not modify!)
- Returns:
The bin edges of the histogram
- Return type:
numpy.ndarray
- getAlpha()#
Returns the opacity of the item
- Return type:
float in [0, 1.]
- getColor()#
Returns the RGBA color of the item
- Return type:
4-tuple of float in [0, 1] or array of colors
- getData(copy=True)[source]#
Return the histogram values, bin edges and baseline
- Parameters:
copy – True (Default) to get a copy, False to use internal representation (do not modify!)
- Returns:
(N histogram value, N+1 bin edges)
- Return type:
2-tuple of numpy.nadarray
- getLineStyle()#
Return the type of the line
Type of line:
- ' ' no line - '-' solid line - '--' dashed line - '-.' dash-dot line - ':' dotted line - (offset, (dash pattern))
- Return type:
Union[str,tuple[Union[float,int],None],tuple[Union[float,int],tuple[Union[float,int],Union[float,int]]],tuple[Union[float,int],tuple[Union[float,int],Union[float,int],Union[float,int],Union[float,int]]]]
- getLineWidth()#
Return the curve line width in pixels
- Return type:
float
- getYAxis()#
Returns the Y axis this curve belongs to.
Either ‘left’ or ‘right’.
- Return type:
str
- isFill()#
Returns whether the item is filled or not.
- Return type:
bool
- setAlpha(alpha)#
Set the opacity of the item
Note
If the colormap already has some transparency, this alpha adds additional transparency. The alpha channel of the colormap is multiplied by this value.
- Parameters:
alpha (float) – Opacity of the item, between 0 (full transparency) and 1. (full opacity)
- setColor(color, copy=True)#
Set item color
- Parameters:
color (str ("#RRGGBB") or (npoints, 4) unsigned byte array or one of the predefined color names defined in colors.py) – color(s) to be used
copy (bool) – True (Default) to get a copy, False to use internal representation (do not modify!)
- setFill(fill)#
Set whether to fill the item or not.
- Parameters:
fill (bool)
- setLineStyle(style)#
Set the style of the curve line.
See
getLineStyle().- Parameters:
style (
Union[str,tuple[Union[float,int],None],tuple[Union[float,int],tuple[Union[float,int],Union[float,int]]],tuple[Union[float,int],tuple[Union[float,int],Union[float,int],Union[float,int],Union[float,int]]],None]) – Line style
- setLineWidth(width)#
Set the width in pixel of the curve line
See
getLineWidth().- Parameters:
width (
float)
- setYAxis(yaxis)#
Set the Y axis this curve belongs to.
- Parameters:
yaxis (str) – ‘left’ or ‘right’
- setData(histogram, edges, align='center', baseline=None, copy=True)[source]#
Set the histogram values and bin edges.
- Parameters:
histogram (numpy.ndarray) – The values of the histogram.
edges (numpy.ndarray) – The bin edges of the histogram. If histogram and edges have the same length, the bin edges are computed according to the align parameter.
align (str) – In case histogram values and edges have the same length N, the N+1 bin edges are computed according to the alignment in: ‘center’ (default), ‘left’, ‘right’.
baseline (Union[None,float,numpy.ndarray]) – histogram baseline
copy (bool) – True make a copy of the data (default), False to use provided arrays.
Markers#
- class Marker[source]#
Description of a marker
- getConstraint()#
Returns the dragging constraint of this item
- getPosition()#
Returns the (x, y) position of the marker in data coordinates
- Return type:
tuple[float|None,float|None]
- getSymbol()#
Return the point marker type.
Marker type:
- 'o' circle
- '.' point
- ',' pixel
- '+' cross
- 'x' x-cross
- 'd' diamond
- 's' square
- Return type:
str
- getSymbolSize(copy=True)#
Return the marker size in points.
- Parameters:
copy (
bool)- Return type:
float
- getText()#
Returns marker text.
- Return type:
str
- getXPosition()#
Returns the X position of the marker line in data coordinates
- Return type:
float or None
- getYPosition()#
Returns the Y position of the marker line in data coordinates
- Return type:
float or None
- setPosition(x, y)#
Set marker position in data coordinates
Constraint are applied if any.
- Parameters:
x (
float) – X coordinates in data framey (
float) – Y coordinates in data frame
- setSymbol(symbol)#
Set the marker type
See
getSymbol().- Parameters:
symbol (str) – Marker type or marker name
- setSymbolSize(size, copy=True)#
Set the marker size in points.
See
getSymbolSize().- Parameters:
size (
float|None)copy (
bool)
- setText(text)#
Set the text of the marker.
- Parameters:
text (str) – The text to use
- class XMarker[source]#
Description of a marker
- getConstraint()#
Returns the dragging constraint of this item
- getPosition()#
Returns the (x, y) position of the marker in data coordinates
- Return type:
tuple[float|None,float|None]
- getText()#
Returns marker text.
- Return type:
str
- getXPosition()#
Returns the X position of the marker line in data coordinates
- Return type:
float or None
- getYPosition()#
Returns the Y position of the marker line in data coordinates
- Return type:
float or None
- setText(text)#
Set the text of the marker.
- Parameters:
text (str) – The text to use
- class YMarker[source]#
Description of a marker
- getConstraint()#
Returns the dragging constraint of this item
- getPosition()#
Returns the (x, y) position of the marker in data coordinates
- Return type:
tuple[float|None,float|None]
- getText()#
Returns marker text.
- Return type:
str
- getXPosition()#
Returns the X position of the marker line in data coordinates
- Return type:
float or None
- getYPosition()#
Returns the Y position of the marker line in data coordinates
- Return type:
float or None
- setText(text)#
Set the text of the marker.
- Parameters:
text (str) – The text to use
Shapes#
- class Shape(type_)[source]#
Description of a shape item
- Parameters:
type (str) – The type of shape in: ‘hline’, ‘polygon’, ‘rectangle’, ‘vline’, ‘polylines’
- getType()[source]#
Returns the type of shape to draw.
One of: ‘hline’, ‘polygon’, ‘rectangle’, ‘vline’, ‘polylines’
- Return type:
str
- getPoints(copy=True)[source]#
Get the control points of the shape.
- Parameters:
copy (
bool) – True (Default) to get a copy, False to use internal representation (do not modify!)- Returns:
Array of point coordinates
- Return type:
ndarray
- setPoints(points, copy=True)[source]#
Set the point coordinates
- Parameters:
points (numpy.ndarray) – Array of point coordinates
copy (bool) – True (Default) to get a copy, False to use internal representation (do not modify!)
- Returns:
- getColor()#
Returns the RGBA color of the item
- Return type:
4-tuple of float in [0, 1] or array of colors
- isFill()#
Returns whether the item is filled or not.
- Return type:
bool
- setColor(color, copy=True)#
Set item color
- Parameters:
color (str ("#RRGGBB") or (npoints, 4) unsigned byte array or one of the predefined color names defined in colors.py) – color(s) to be used
copy (bool) – True (Default) to get a copy, False to use internal representation (do not modify!)
- setFill(fill)#
Set whether to fill the item or not.
- Parameters:
fill (bool)
- setOverlay(overlay)#
Set the overlay state of the shape
- Parameters:
overlay (
bool) – True to make it an overlay
Item changed signal#
Plot items emit a Item.sigItemChanged signal when their values are updated.
This signal provides a flag in the following enumeration describing the modified value:
- class ItemChangedType(*values)[source]#
Type of modification provided by
Item.sigItemChangedsignal.- VISIBLE = 'visibleChanged'#
Item’s visibility changed flag.
- ZVALUE = 'zValueChanged'#
Item’s Z value changed flag.
- COLORMAP = 'colormapChanged'#
Item’s colormap changed flag.
This is emitted both when setting a new colormap and when the current colormap object is updated.
- SYMBOL = 'symbolChanged'#
Item’s symbol changed flag.
- SYMBOL_SIZE = 'symbolSizeChanged'#
Item’s symbol size changed flag.
- LINE_WIDTH = 'lineWidthChanged'#
Item’s line width changed flag.
- LINE_STYLE = 'lineStyleChanged'#
Item’s line style changed flag.
- COLOR = 'colorChanged'#
Item’s color changed flag.
- LINE_GAP_COLOR = 'lineGapColorChanged'#
Item’s dashed line gap color changed flag.
- YAXIS = 'yAxisChanged'#
Item’s Y axis binding changed flag.
- FILL = 'fillChanged'#
Item’s fill changed flag.
- ALPHA = 'alphaChanged'#
Item’s transparency alpha changed flag.
- DATA = 'dataChanged'#
Item’s data changed flag
- MASK = 'maskChanged'#
Item’s mask changed flag
- HIGHLIGHTED = 'highlightedChanged'#
Item’s highlight state changed flag.
- HIGHLIGHTED_COLOR = 'highlightedColorChanged'#
Deprecated, use HIGHLIGHTED_STYLE instead.
- HIGHLIGHTED_STYLE = 'highlightedStyleChanged'#
Item’s highlighted style changed flag.
- SCALE = 'scaleChanged'#
Item’s scale changed flag.
- TEXT = 'textChanged'#
Item’s text changed flag.
- POSITION = 'positionChanged'#
Item’s position changed flag.
This is emitted when a marker position changed and when an image origin changed.
- OVERLAY = 'overlayChanged'#
Item’s overlay state changed flag.
- VISUALIZATION_MODE = 'visualizationModeChanged'#
Item’s visualization mode changed flag.
- COMPLEX_MODE = 'complexModeChanged'#
Item’s complex data visualization mode changed flag.
- NAME = 'nameChanged'#
Item’s name changed flag.
- EDITABLE = 'editableChanged'#
Item’s editable state changed flags.
- SELECTABLE = 'selectableChanged'#
Item’s selectable state changed flags.
- FONT = 'fontChanged'#
Item’s text font changed flag.
- BACKGROUND_COLOR = 'backgroundColorChanged'#
Item’s text background color changed flag.
Axis#
- class Axis(plot)[source]#
This class describes and controls a plot axis.
Note: This is an abstract class.
- LINEAR = 'linear'#
Constant defining a linear scale
- LOGARITHMIC = 'log'#
Constant defining a logarithmic scale
- sigInvertedChanged#
Signal emitted when axis orientation has changed
- sigScaleChanged#
Signal emitted when axis scale has changed
- sigAutoScaleChanged#
Signal emitted when axis autoscale has changed
- sigLimitsChanged#
Signal emitted when axis limits have changed
- getLimits()[source]#
Get the limits of this axis.
- Return type:
tuple[float,float]- Returns:
Minimum and maximum values of this axis as tuple
- setLimits(vmin, vmax)[source]#
Set this axis limits.
- Parameters:
vmin (
float) – minimum axis valuevmax (
float) – maximum axis value
- isInverted()[source]#
Return True if the axis is inverted, False otherwise. An inverted x-axis goes right to left. An inverted y-axis goes top to bottom.
- Return type:
bool
- setInverted(flag)[source]#
Set the axis orientation.
If True, x-axis will go right to left and y-axis will go top to bottom.
If False, x-axis will go left to right and y-axis will go bottom to top.
- Parameters:
flag (
bool) – True for Y axis going from top to bottom, False for Y axis going from bottom to top
- getLabel()[source]#
Return the current displayed label of this axis.
- Parameters:
axis (str) – The Y axis for which to get the label (left or right)
- Return type:
str
- setLabel(label)[source]#
Set the label displayed on the plot for this axis.
The provided label can be temporarily replaced by the label of the active curve if any.
- Parameters:
label (
str) – The axis label
- getScale()[source]#
Return the name of the scale used by this axis.
- Return type:
Literal['linear','log']
- setScale(scale)[source]#
Set the scale to be used by this axis.
- Parameters:
scale (
Literal['linear','log']) – Name of the scale (“log”, or “linear”)
- getTimeZone()[source]#
Sets tzinfo that is used if this axis plots date times.
None means the datetimes are interpreted as local time.
- Return type:
tzinfo|None
- setTimeZone(tz)[source]#
Sets tzinfo that is used if this axis’ tickMode is TIME_SERIES
The tz must be a descendant of the datetime.tzinfo class, “UTC” or None. Use None to let the datetimes be interpreted as local time. Use the string “UTC” to let the date datetimes be in UTC time.
- Parameters:
tz – A timezone, “UTC” or None.
- Return type:
Union[tzinfo,Literal['UTC'],None]
- getTickMode()[source]#
Determines if axis ticks are number or datetimes.
- Return type:
TickMode enum.
- setTickMode(tickMode)[source]#
Determines if axis ticks are number or datetimes.
- Parameters:
tickMode (TickMode) – tick mode enum.
- setAutoScale(flag=True)[source]#
Set the axis limits adjusting behavior of
resetZoom().- Parameters:
flag (bool) – True to resize limits automatically, False to disable it.
- setLimitsConstraints(minPos=None, maxPos=None)[source]#
Set a constraint on the position of the axes.
- Parameters:
minPos (float) – Minimum allowed axis value.
maxPos (float) – Maximum allowed axis value.
- Returns:
True if the constaints was updated
- Return type:
bool
- setRangeConstraints(minRange=None, maxRange=None)[source]#
Set a constraint on the position of the axes.
- Parameters:
minRange (float) – Minimum allowed left-to-right span across the view
maxRange (float) – Maximum allowed left-to-right span across the view
- Returns:
True if the constaints was updated
- Return type:
bool
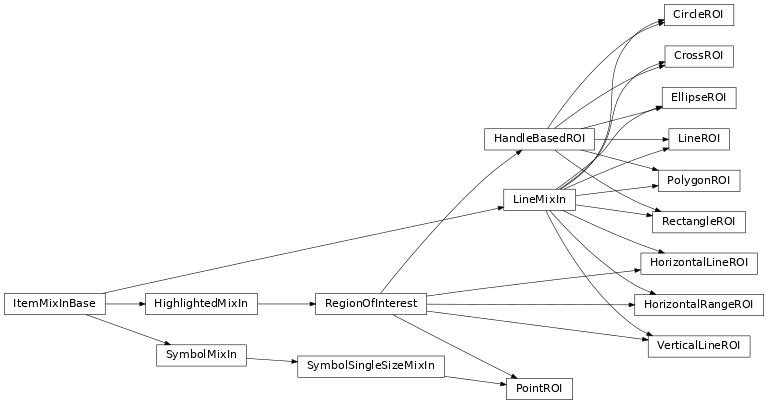
roi: Regions of Interest#
This module provides ROI item for the PlotWidget.
- class ArcROI(parent=None)[source]#
Bases:
HandleBasedROI,LineMixIn,InteractionModeMixInA ROI identifying an arc of a circle with a width.
This ROI provides - 3 handle to control the curvature - 1 handle to control the weight - 1 anchor to translate the shape.
- ICON = 'add-shape-arc'#
Metadata to describe the ROI in labels, tooltips and widgets
Should be set by inherited classes to custom the ROI manager widget.
- NAME = 'arc ROI'#
Metadata to describe the ROI in labels, tooltips and widgets
Should be set by inherited classes to custom the ROI manager widget.
- SHORT_NAME = 'arc'#
Metadata for this kind of ROI
- class Role(*values)[source]#
Bases:
EnumIdentify a set of roles which can be used for now to reach some positions
- START = 0#
Location of the anchor at the start of the arc
- STOP = 1#
Location of the anchor at the stop of the arc
- MIDDLE = 2#
Location of the anchor at the middle of the arc
- CENTER = 3#
Location of the center of the circle
- availableInteractionModes()[source]#
Returns the list of available interaction modes
- Return type:
List[RoiInteractionMode]
- setFirstShapePoints(points)[source]#
Initialize the ROI using the points from the first interaction.
This interaction is constrained by the plot API and only supports few shapes.
- handleDragUpdated(handle, origin, previous, current)[source]#
Called when an handle drag position changed
- getGeometry()[source]#
Returns a tuple containing the geometry of this ROI
It is a symmetric function of
setGeometry().If startAngle is smaller than endAngle the rotation is clockwise, else the rotation is anticlockwise.
- Return type:
Tuple[numpy.ndarray,float,float,float,float]
- Raises:
ValueError – In case the ROI can’t be represented as section of a circle
- getPosition(role=Role.CENTER)[source]#
Returns a position by it’s role.
By default returns the center of the circle of the arc ROI.
- Parameters:
role (
Role)- Return type:
tuple[float,float]
- isClosed()[source]#
Returns true if the arc is a closed shape, like a circle or a donut.
- Return type:
bool
- getCenter()[source]#
Returns the center of the circle used to draw arcs of this ROI.
This center is usually outside the the shape itself.
- Return type:
numpy.ndarray
- getStartAngle()[source]#
Returns the angle of the start of the section of this ROI (in radian).
If startAngle is smaller than endAngle the rotation is clockwise, else the rotation is anticlockwise.
- Return type:
float
- getEndAngle()[source]#
Returns the angle of the end of the section of this ROI (in radian).
If startAngle is smaller than endAngle the rotation is clockwise, else the rotation is anticlockwise.
- Return type:
float
- getInnerRadius()[source]#
Returns the radius of the smaller arc used to draw this ROI.
- Return type:
float
- getOuterRadius()[source]#
Returns the radius of the bigger arc used to draw this ROI.
- Return type:
float
- setGeometry(center, innerRadius, outerRadius, startAngle, endAngle)[source]#
Set the geometry of this arc.
- Parameters:
center (numpy.ndarray) – Center of the circle.
innerRadius (float) – Radius of the smaller arc of the section.
outerRadius (float) – Weight of the bigger arc of the section. It have to be bigger than innerRadius
startAngle (float) – Location of the start of the section (in radian)
endAngle (float) – Location of the end of the section (in radian). If startAngle is smaller than endAngle the rotation is clockwise, else the rotation is anticlockwise.
- contains(position)[source]#
Check which positions are inside the ROI.
- Parameters:
position (
TypeAliasType) – array-like of positions, where each position is given as(x, y). If multiple positions are provided, the shape should be(N, 2). For a single position, the shape should be(2,).- Return type:
Union[bool,ndarray]- Returns:
boolean or boolean array of shape
(N,), True if the point is inside the ROI.
- class BandROI(parent=None)[source]#
Bases:
HandleBasedROI,LineMixIn,InteractionModeMixInA ROI identifying a line in a 2D plot.
This ROI provides 1 anchor for each boundary of the line, plus an center in the center to translate the full ROI.
- ICON = 'add-shape-rotated-rectangle'#
Metadata to describe the ROI in labels, tooltips and widgets
Should be set by inherited classes to custom the ROI manager widget.
- NAME = 'band ROI'#
Metadata to describe the ROI in labels, tooltips and widgets
Should be set by inherited classes to custom the ROI manager widget.
- SHORT_NAME = 'band'#
Metadata for this kind of ROI
- BoundedMode = <silx.gui.plot.items._roi_base.RoiInteractionMode object>#
Interaction mode for a rectangular band ROI
- UnboundedMode = <silx.gui.plot.items._roi_base.RoiInteractionMode object>#
Interaction mode for unlimited band ROI
- availableInteractionModes()[source]#
Returns the list of available interaction modes
- Return type:
list[RoiInteractionMode]
- setAvailableInteractionModes(modes)[source]#
Allows to restrict interaction modes of the ROI.
- Parameters:
modes (
Iterable[RoiInteractionMode]) – Subset of BandROI interaction modes:BoundedModeandUnboundedMode.- Return type:
None
- setFirstShapePoints(points)[source]#
Initialize the ROI using the points from the first interaction.
This interaction is constrained by the plot API and only supports few shapes.
- setGeometry(begin, end, width=None)[source]#
Set the geometry of the ROI
- Parameters:
begin (
Sequence[float]) – Starting point as (x, y)width (
float|None) – Width of the ROIend (
Sequence[float])
- Paran end:
Closing point as (x, y)
- handleDragUpdated(handle, origin, previous, current)[source]#
Called when an handle drag position changed
- contains(position)[source]#
Check which positions are inside the ROI.
- Parameters:
position (
TypeAliasType) – array-like of positions, where each position is given as(x, y). If multiple positions are provided, the shape should be(N, 2). For a single position, the shape should be(2,).- Return type:
Union[bool,ndarray]- Returns:
boolean or boolean array of shape
(N,), True if the point is inside the ROI.
- class PointROI(parent=None)[source]#
Bases:
RegionOfInterest,SymbolSingleSizeMixInA ROI identifying a point in a 2D plot.
- ICON = 'add-shape-point'#
Metadata to describe the ROI in labels, tooltips and widgets
Should be set by inherited classes to custom the ROI manager widget.
- NAME = 'point markers'#
Metadata to describe the ROI in labels, tooltips and widgets
Should be set by inherited classes to custom the ROI manager widget.
- SHORT_NAME = 'point'#
Metadata for this kind of ROI
- setFirstShapePoints(points)[source]#
Initialize the ROI using the points from the first interaction.
This interaction is constrained by the plot API and only supports few shapes.
- setPosition(pos)[source]#
Set the position of this ROI
- Parameters:
pos (
tuple[float,float]) – 2d-coordinate of this point
- contains(position)[source]#
Check which positions are inside the ROI.
- Parameters:
position (
TypeAliasType) – array-like of positions, where each position is given as(x, y). If multiple positions are provided, the shape should be(N, 2). For a single position, the shape should be(2,).- Return type:
Union[bool,ndarray]- Returns:
boolean or boolean array of shape
(N,), True if the point is inside the ROI.
- class CrossROI(parent=None)[source]#
Bases:
HandleBasedROI,LineMixInA ROI identifying a point in a 2D plot and displayed as a cross
- ICON = 'add-shape-cross'#
Metadata to describe the ROI in labels, tooltips and widgets
Should be set by inherited classes to custom the ROI manager widget.
- NAME = 'cross marker'#
Metadata to describe the ROI in labels, tooltips and widgets
Should be set by inherited classes to custom the ROI manager widget.
- SHORT_NAME = 'cross'#
Metadata for this kind of ROI
- setFirstShapePoints(points)[source]#
Initialize the ROI using the points from the first interaction.
This interaction is constrained by the plot API and only supports few shapes.
- setPosition(pos)[source]#
Set the position of this ROI
- Parameters:
pos (
tuple[float,float]) – 2d-coordinate of this point
- contains(position)[source]#
Check which positions are inside the ROI.
- Parameters:
position (
TypeAliasType) – array-like of positions, where each position is given as(x, y). If multiple positions are provided, the shape should be(N, 2). For a single position, the shape should be(2,).- Return type:
Union[bool,ndarray]- Returns:
boolean or boolean array of shape
(N,), True if the point is inside the ROI.
- class LineROI(parent=None)[source]#
Bases:
HandleBasedROI,LineMixInA ROI identifying a line in a 2D plot.
This ROI provides 1 anchor for each boundary of the line, plus an center in the center to translate the full ROI.
- ICON = 'add-shape-diagonal'#
Metadata to describe the ROI in labels, tooltips and widgets
Should be set by inherited classes to custom the ROI manager widget.
- NAME = 'line ROI'#
Metadata to describe the ROI in labels, tooltips and widgets
Should be set by inherited classes to custom the ROI manager widget.
- SHORT_NAME = 'line'#
Metadata for this kind of ROI
- setFirstShapePoints(points)[source]#
Initialize the ROI using the points from the first interaction.
This interaction is constrained by the plot API and only supports few shapes.
- setEndPoints(startPoint, endPoint)[source]#
Set this line location using the ending points
- Parameters:
startPoint (
ndarray) – Staring bounding point of the lineendPoint (
ndarray) – Ending bounding point of the line
- handleDragUpdated(handle, origin, previous, current)[source]#
Called when an handle drag position changed
- contains(position)[source]#
Check which positions are inside the ROI.
- Parameters:
position (
TypeAliasType) – array-like of positions, where each position is given as(x, y). If multiple positions are provided, the shape should be(N, 2). For a single position, the shape should be(2,).- Return type:
Union[bool,ndarray]- Returns:
boolean or boolean array of shape
(N,), True if the point is inside the ROI.
- class HorizontalLineROI(parent=None)[source]#
Bases:
RegionOfInterest,LineMixInA ROI identifying an horizontal line in a 2D plot.
- ICON = 'add-shape-horizontal'#
Metadata to describe the ROI in labels, tooltips and widgets
Should be set by inherited classes to custom the ROI manager widget.
- NAME = 'horizontal line ROI'#
Metadata to describe the ROI in labels, tooltips and widgets
Should be set by inherited classes to custom the ROI manager widget.
- SHORT_NAME = 'hline'#
Metadata for this kind of ROI
- setFirstShapePoints(points)[source]#
Initialize the ROI using the points from the first interaction.
This interaction is constrained by the plot API and only supports few shapes.
- setPosition(pos)[source]#
Set the position of this ROI
- Parameters:
pos (
float) – Horizontal position of this line
- contains(position)[source]#
Check which positions are inside the ROI.
- Parameters:
position (
TypeAliasType) – array-like of positions, where each position is given as(x, y). If multiple positions are provided, the shape should be(N, 2). For a single position, the shape should be(2,).- Return type:
Union[bool,ndarray]- Returns:
boolean or boolean array of shape
(N,), True if the point is inside the ROI.
- class VerticalLineROI(parent=None)[source]#
Bases:
RegionOfInterest,LineMixInA ROI identifying a vertical line in a 2D plot.
- ICON = 'add-shape-vertical'#
Metadata to describe the ROI in labels, tooltips and widgets
Should be set by inherited classes to custom the ROI manager widget.
- NAME = 'vertical line ROI'#
Metadata to describe the ROI in labels, tooltips and widgets
Should be set by inherited classes to custom the ROI manager widget.
- SHORT_NAME = 'vline'#
Metadata for this kind of ROI
- setFirstShapePoints(points)[source]#
Initialize the ROI using the points from the first interaction.
This interaction is constrained by the plot API and only supports few shapes.
- setPosition(pos)[source]#
Set the position of this ROI
- Parameters:
pos (
float) – Horizontal position of this line
- contains(position)[source]#
Check which positions are inside the ROI.
- Parameters:
position (
TypeAliasType) – array-like of positions, where each position is given as(x, y). If multiple positions are provided, the shape should be(N, 2). For a single position, the shape should be(2,).- Return type:
Union[bool,ndarray]- Returns:
boolean or boolean array of shape
(N,), True if the point is inside the ROI.
- class RectangleROI(parent=None)[source]#
Bases:
HandleBasedROI,LineMixInA ROI identifying a rectangle in a 2D plot.
This ROI provides 1 anchor for each corner, plus an anchor in the center to translate the full ROI.
- ICON = 'add-shape-rectangle'#
Metadata to describe the ROI in labels, tooltips and widgets
Should be set by inherited classes to custom the ROI manager widget.
- NAME = 'rectangle ROI'#
Metadata to describe the ROI in labels, tooltips and widgets
Should be set by inherited classes to custom the ROI manager widget.
- SHORT_NAME = 'rectangle'#
Metadata for this kind of ROI
- setFirstShapePoints(points)[source]#
Initialize the ROI using the points from the first interaction.
This interaction is constrained by the plot API and only supports few shapes.
- getCenter()[source]#
Returns the central point of this rectangle
- Return type:
numpy.ndarray([float,float])
- getOrigin()[source]#
Returns the corner point with the smaller coordinates
- Return type:
numpy.ndarray([float,float])
- setOrigin(position)[source]#
Set the origin position of this ROI
- Parameters:
position (numpy.ndarray) – Location of the smaller corner of the ROI
- setSize(size)[source]#
Set the size of this ROI
- Parameters:
size (numpy.ndarray) – Size of the center of the ROI
- setCenter(position)[source]#
Set the size of this ROI
- Parameters:
position (numpy.ndarray) – Location of the center of the ROI
- contains(position)[source]#
Check which positions are inside the ROI.
- Parameters:
position (
TypeAliasType) – array-like of positions, where each position is given as(x, y). If multiple positions are provided, the shape should be(N, 2). For a single position, the shape should be(2,).- Return type:
Union[bool,ndarray]- Returns:
boolean or boolean array of shape
(N,), True if the point is inside the ROI.
- class CircleROI(parent=None)[source]#
Bases:
HandleBasedROI,LineMixInA ROI identifying a circle in a 2D plot.
This ROI provides 1 anchor at the center to translate the circle, and one anchor on the perimeter to change the radius.
- ICON = 'add-shape-circle'#
Metadata to describe the ROI in labels, tooltips and widgets
Should be set by inherited classes to custom the ROI manager widget.
- NAME = 'circle ROI'#
Metadata to describe the ROI in labels, tooltips and widgets
Should be set by inherited classes to custom the ROI manager widget.
- SHORT_NAME = 'circle'#
Metadata for this kind of ROI
- setFirstShapePoints(points)[source]#
Initialize the ROI using the points from the first interaction.
This interaction is constrained by the plot API and only supports few shapes.
- getCenter()[source]#
Returns the central point of this rectangle
- Return type:
numpy.ndarray([float,float])
- setCenter(position)[source]#
Set the center point of this ROI
- Parameters:
position (numpy.ndarray) – Location of the center of the circle
- handleDragUpdated(handle, origin, previous, current)[source]#
Called when an handle drag position changed
- contains(position)[source]#
Check which positions are inside the ROI.
- Parameters:
position (
TypeAliasType) – array-like of positions, where each position is given as(x, y). If multiple positions are provided, the shape should be(N, 2). For a single position, the shape should be(2,).- Return type:
Union[bool,ndarray]- Returns:
boolean or boolean array of shape
(N,), True if the point is inside the ROI.
- class EllipseROI(parent=None)[source]#
Bases:
HandleBasedROI,LineMixInA ROI identifying an oriented ellipse in a 2D plot.
This ROI provides 1 anchor at the center to translate the circle, and two anchors on the perimeter to modify the major-radius and minor-radius. These two anchors also allow to change the orientation.
- ICON = 'add-shape-ellipse'#
Metadata to describe the ROI in labels, tooltips and widgets
Should be set by inherited classes to custom the ROI manager widget.
- NAME = 'ellipse ROI'#
Metadata to describe the ROI in labels, tooltips and widgets
Should be set by inherited classes to custom the ROI manager widget.
- SHORT_NAME = 'ellipse'#
Metadata for this kind of ROI
- setFirstShapePoints(points)[source]#
Initialize the ROI using the points from the first interaction.
This interaction is constrained by the plot API and only supports few shapes.
- getCenter()[source]#
Returns the central point of this rectangle
- Return type:
numpy.ndarray([float,float])
- getOrientation()[source]#
Return angle in radians between the horizontal (X) axis and the major axis of the ellipse in [0, 2*pi[
- Return type:
float:
- setCenter(center)[source]#
Set the center point of this ROI
- Parameters:
position (numpy.ndarray) – Coordinates (X, Y) of the center of the ellipse
- setMajorRadius(radius)[source]#
Set the half-diameter of the major axis of the ellipse.
- Parameters:
radius (float) – Major radius of the ellipsis. Must be a positive value.
- setMinorRadius(radius)[source]#
Set the half-diameter of the minor axis of the ellipse.
- Parameters:
radius (float) – Minor radius of the ellipsis. Must be a positive value.
- setOrientation(orientation)[source]#
Rotate the ellipse
- Parameters:
orientation (float) – Angle in radians between the horizontal and the major axis.
- Returns:
- setGeometry(center=None, radius=None, orientation=None)[source]#
- Parameters:
center – (X, Y) coordinates
majorRadius (float)
minorRadius (float)
orientation (float) – angle in radians between the major axis and the horizontal
- Returns:
- handleDragUpdated(handle, origin, previous, current)[source]#
Called when an handle drag position changed
- contains(position)[source]#
Check which positions are inside the ROI.
- Parameters:
position (
TypeAliasType) – array-like of positions, where each position is given as(x, y). If multiple positions are provided, the shape should be(N, 2). For a single position, the shape should be(2,).- Return type:
Union[bool,ndarray]- Returns:
boolean or boolean array of shape
(N,), True if the point is inside the ROI.
- class PolygonROI(parent=None)[source]#
Bases:
HandleBasedROI,LineMixInA ROI identifying a closed polygon in a 2D plot.
This ROI provides 1 anchor for each point of the polygon.
- ICON = 'add-shape-polygon'#
Metadata to describe the ROI in labels, tooltips and widgets
Should be set by inherited classes to custom the ROI manager widget.
- NAME = 'polygon ROI'#
Metadata to describe the ROI in labels, tooltips and widgets
Should be set by inherited classes to custom the ROI manager widget.
- SHORT_NAME = 'polygon'#
Metadata for this kind of ROI
- setFirstShapePoints(points)[source]#
Initialize the ROI using the points from the first interaction.
This interaction is constrained by the plot API and only supports few shapes.
- setPoints(points)[source]#
Set the position of this ROI
- Parameters:
pos (numpy.ndarray) – 2d-coordinate of this point
points (
ndarray)
- handleDragUpdated(handle, origin, previous, current)[source]#
Called when an handle drag position changed
- contains(position)[source]#
Check which positions are inside the ROI.
- Parameters:
position (
TypeAliasType) – array-like of positions, where each position is given as(x, y). If multiple positions are provided, the shape should be(N, 2). For a single position, the shape should be(2,).- Return type:
Union[bool,ndarray]- Returns:
boolean or boolean array of shape
(N,), True if the point is inside the ROI.
- class HorizontalRangeROI(parent=None)[source]#
Bases:
RegionOfInterest,LineMixInA ROI identifying an horizontal range in a 1D plot.
- ICON = 'add-range-horizontal'#
Metadata to describe the ROI in labels, tooltips and widgets
Should be set by inherited classes to custom the ROI manager widget.
- NAME = 'horizontal range ROI'#
Metadata to describe the ROI in labels, tooltips and widgets
Should be set by inherited classes to custom the ROI manager widget.
- SHORT_NAME = 'hrange'#
Metadata to describe the ROI in labels, tooltips and widgets
Should be set by inherited classes to custom the ROI manager widget.
- setFirstShapePoints(points)[source]#
Initialize the ROI using the points from the first interaction.
This interaction is constrained by the plot API and only supports few shapes.
- setRange(vmin, vmax)[source]#
Set the range of this ROI.
- Parameters:
vmin (
float) – Staring location of the rangevmax (
float) – Ending location of the range
- contains(position)[source]#
Check which positions are inside the ROI.
- Parameters:
position (
TypeAliasType) – array-like of positions, where each position is given as(x, y). If multiple positions are provided, the shape should be(N, 2). For a single position, the shape should be(2,).- Return type:
Union[bool,ndarray]- Returns:
boolean or boolean array of shape
(N,), True if the point is inside the ROI.
Base class for regions of interest#
- class _RegionOfInterestBase(parent=None)[source]#
Bases:
QObjectBase class of 1D and 2D region of interest
- Parameters:
parent (QObject) – See QObject
name (str) – The name of the ROI
- sigAboutToBeRemoved#
Signal emitted just before this ROI is removed from its manager.
- sigItemChanged#
Signal emitted when item has changed.
It provides a flag describing which property of the item has changed. See
ItemChangedTypefor flags description.
- getName()[source]#
Returns the name of the ROI
- Return type:
str- Returns:
name of the region of interest
- setName(name)[source]#
Set the name of the ROI
- Parameters:
name (
str) – name of the region of interest
- contains(position)[source]#
Check which positions are inside the ROI.
- Parameters:
position (
TypeAliasType) – array-like of positions, where each position is given as(x, y). If multiple positions are provided, the shape should be(N, 2). For a single position, the shape should be(2,).- Return type:
Union[bool,ndarray]- Returns:
boolean or boolean array of shape
(N,), True if the point is inside the ROI.
- class RegionOfInterest(parent=None)[source]#
Bases:
_RegionOfInterestBase,HighlightedMixInObject describing a region of interest in a plot.
- Parameters:
parent (QObject) – The RegionOfInterestManager that created this object
- ICON = None#
Metadata to describe the ROI in labels, tooltips and widgets
Should be set by inherited classes to custom the ROI manager widget.
- NAME = None#
Metadata to describe the ROI in labels, tooltips and widgets
Should be set by inherited classes to custom the ROI manager widget.
- SHORT_NAME = None#
Metadata to describe the ROI in labels, tooltips and widgets
Should be set by inherited classes to custom the ROI manager widget.
- sigRegionChanged#
Signal emitted everytime the shape or position of the ROI changes
- sigEditingStarted#
Signal emitted when the user start editing the roi
- sigEditingFinished#
Signal emitted when the region edition is finished. During edition sigEditionChanged will be emitted several times and sigRegionEditionFinished only at end
- setParent(parent)[source]#
Set the parent of the RegionOfInterest
- Parameters:
parent (Union[None,RegionOfInterestManager]) – The new parent
- addItem(item)[source]#
Add an item to the set of this ROI children.
This item will be added and removed to the plot used by the ROI.
If the ROI is already part of a plot, the item will also be added to the plot.
It the item do not have a name already, a unique one is generated to avoid item collision in the plot.
- Parameters:
item (silx.gui.plot.items.Item) – A plot item
- removeItem(item)[source]#
Remove an item from this ROI children.
If the item is part of a plot it will be removed too.
- Parameters:
item (silx.gui.plot.items.Item) – A plot item
- getItems()[source]#
Returns the list of PlotWidget items of this RegionOfInterest.
- Return type:
List[Item]
- setColor(color)[source]#
Set the color used for this ROI.
- Parameters:
color – The color to use for ROI shape as either a color name, a QColor, a list of uint8 or float in [0, 1].
- setEditable(editable)[source]#
Set whether the ROI can be changed interactively.
- Parameters:
editable (bool) – True to allow edition by the user, False to disable.
- setSelectable(selectable)[source]#
Set whether the ROI can be selected interactively.
- Parameters:
selectable (bool) – True to allow selection by the user, False to disable.
- getFocusProxy()[source]#
Returns the ROI which have to be selected when this ROI is selected, else None if no proxy specified.
- Return type:
- setFocusProxy(roi)[source]#
Set the real ROI which will be selected when this ROI is selected, else None to remove the proxy already specified.
- Parameters:
roi (RegionOfInterest) – A ROI
- isVisible()[source]#
Returns whether the ROI is visible in the plot.
Note
This does not take into account whether or not the plot widget itself is visible (unlike
QWidget.isVisible()which checks the visibility of all its parent widgets up to the window)- Return type:
bool
- setVisible(visible)[source]#
Set whether the plot items associated with this ROI are visible in the plot.
- Parameters:
visible (bool) – True to show the ROI in the plot, False to hide it.
- setText(text=None)[source]#
Set the displayed text for this ROI.
If None (the default), the ROI name is used.
- Parameters:
text (
str|None)- Return type:
None
- classmethod showFirstInteractionShape()[source]#
Returns True if the shape created by the first interaction and managed by the plot have to be visible.
- Return type:
bool
- classmethod getFirstInteractionShape()[source]#
Returns the shape kind which will be used by the very first interaction with the plot.
This interactions are hardcoded inside the plot
- Return type:
str
- setFirstShapePoints(points)[source]#
Initialize the ROI using the points from the first interaction.
This interaction is constrained by the plot API and only supports few shapes.
- Parameters:
points (
ndarray|list[tuple[float,float]])
- class HandleBasedROI(parent=None)[source]#
Bases:
RegionOfInterestManage a ROI based on a set of handles
- addUserHandle(item=None)[source]#
Add a new free handle to the ROI.
This handle do nothing. It have to be managed by the ROI implementing this class.
- addLabelHandle(item=None)[source]#
Add a new label handle to the ROI.
This handle is not draggable nor selectable.
It is displayed without symbol, but it is always visible anyway the ROI is editable, in order to display text.
- addTranslateHandle(item=None)[source]#
Add a new translate handle to the ROI.
Dragging translate handles affect the position position of the ROI but not the shape itself.
- addHandle(item=None, role='default')[source]#
Add a new handle to the ROI.
Dragging handles while affect the position or the shape of the ROI.
- isHandleBeingDragged()[source]#
Returns True if one of the handles is currently being dragged.
- Return type:
bool
- class InteractionModeMixIn[source]#
Mix in feature which can be implemented by a ROI object.
This provides user interaction to switch between different interaction mode to edit the ROI.
This ROI modes have to be described using RoiInteractionMode, and taken into account during interation with handles.
- availableInteractionModes()[source]#
Returns the list of available interaction modes
Must be implemented when inherited to provide all available modes.
- Return type:
List[RoiInteractionMode]
- setInteractionMode(modeId)[source]#
Set the interaction mode.
- Parameters:
modeId (RoiInteractionMode) – Mode to use
- getInteractionMode()[source]#
Returns the interaction mode.
Must be one of the returned
availableInteractionModes().- Return type: