
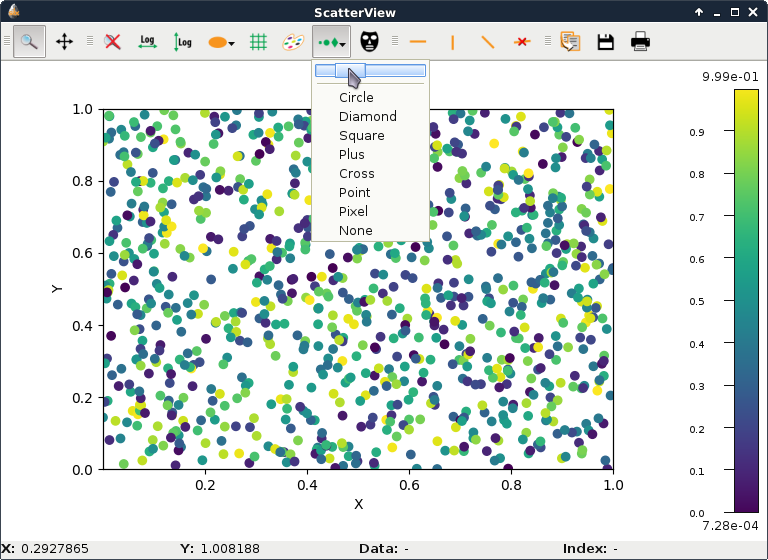
ScatterView: Plot 2D scatter data#
A widget dedicated to display scatter plots
It is based on a PlotWidget with additional tools
for scatter plots.
ScatterView class#
- class ScatterView(parent=None, backend=None)[source]#
Bases:
QMainWindowMain window with a PlotWidget and tools specific for scatter plots.
- Parameters:
parent – The parent of this widget
backend (Union[str,BackendBase]) – The backend to use for the plot (default: matplotlib). See
PlotWidgetfor the list of supported backend.
- getPlotWidget()[source]#
Returns the
PlotWidgetthis window is based on.- Return type:
PlotWidget
- getPositionInfoWidget()[source]#
Returns the widget display mouse coordinates information.
- Return type:
- getMaskToolsWidget()[source]#
Returns the widget controlling mask drawing
- Return type:
ScatterMaskToolsWidget
- getScatterProfileToolBar()[source]#
Returns QToolBar providing scatter profile tools.
- Return type:
ScatterProfileToolBar
- setColormap(colormap=None)[source]#
Set the colormap for the displayed scatter and the default plot colormap.
- Parameters:
colormap (Colormap) – The description of the colormap.
- getColormap()[source]#
Return the colormap object in use.
- Returns:
Colormap currently in use
- Return type:
- setData(x, y, value, xerror=None, yerror=None, alpha=None, copy=True)[source]#
Set the data of the scatter plot.
To reset the scatter plot, set x, y and value to None.
- Parameters:
x (Union[numpy.ndarray,None]) – X coordinates.
y (Union[numpy.ndarray,None]) – Y coordinates.
value (Union[numpy.ndarray,None]) – The data corresponding to the value of the data points.
xerror (A float, or a numpy.ndarray of float32.) – Values with the uncertainties on the x values. If it is an array, it can either be a 1D array of same length as the data or a 2D array with 2 rows of same length as the data: row 0 for positive errors, row 1 for negative errors.
yerror (A float, or a numpy.ndarray of float32. See xerror.) – Values with the uncertainties on the y values
alpha (A float, or a numpy.ndarray of float32) – Values with the transparency (between 0 and 1)
copy (bool) – True make a copy of the data (default), False to use provided arrays.
- getData(*args, **kwargs)[source]#
Returns the x, y coordinates and the value of the data points
- Parameters:
copy – True (Default) to get a copy, False to use internal representation (do not modify!)
displayed – True to only get curve points that are displayed in the plot. Default: False. Note: If plot has log scale, negative points are not displayed.
- Returns:
(x, y, value, xerror, yerror)
- getScatterItem()[source]#
Returns the plot item displaying the scatter data.
This allows to set the style of the displayed scatter.
- Return type:
- getYAxis(*args, **kwargs)[source]#
Returns an Y axis
Added in version 0.6.
- Parameters:
axis – The Y axis to return (‘left’ or ‘right’).
- setGraphTitle(*args, **kwargs)[source]#
Set the plot main title.
- Parameters:
title – Main title of the plot (default: ‘’)
- resetZoom(*args, **kwargs)[source]#
Reset the plot limits to the bounds of the data and redraw the plot.
It automatically scale limits of axes that are in autoscale mode (see
getXAxis(),getYAxis()andAxis.setAutoScale()). It keeps current limits on axes that are not in autoscale mode.Extra margins can be added around the data inside the plot area (see
setDataMargins()). Margins are given as one ratio of the data range per limit of the data (xMin, xMax, yMin and yMax limits). For log scale, extra margins are applied in log10 of the data.- Parameters:
dataMargins – Ratios of margins to add around the data inside the plot area for each side (default: no margins).
- getSelectionMask(*args, **kwargs)[source]#
Get the current mask as a numpy array.
- Parameters:
copy (bool) – True (default) to get a copy of the mask. If False, the returned array MUST not be modified.
- Returns:
The mask (as an array of uint8) with dimension of the ‘active’ plot item. If there is no active image or scatter, it returns None.
- Return type:
Union[numpy.ndarray,None]
- setSelectionMask(*args, **kwargs)[source]#
Set the mask to a new array.
- Parameters:
mask (numpy.ndarray of uint8, C-contiguous. Array of other types are converted.) – The array to use for the mask or None to reset the mask.
copy (bool) – True (the default) to copy the array, False to use it as is if possible.
- Returns:
None if failed, shape of mask as 1-tuple if successful. The mask can be cropped or padded to fit active scatter, the returned shape is that of the scatter data.