
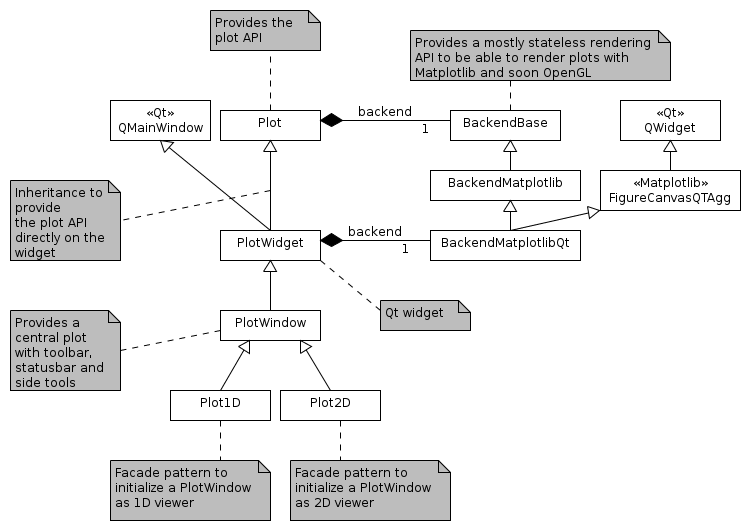
Package structure#
The silx.gui.plot package provides plot widgets.
This package is structured as follows.
PlotWidget and PlotWindow provides the user API.
PlotWidget is a Qt widget (actually a QMainWindow) displaying a 1D, 2D plot area.
It provides different interaction modes.
PlotWindow is a Qt widget (actually a QMainWindow) which adds a set of toolbar buttons and associated functionalities to PlotWidget.
The toolbar QActions are implemented in actions.
Plot, PlotEvents and PlotInteraction implement the plotting API regardless of the rendering backend and regardless of its integration in Qt.
The plotting API in defined in Plot.
The different interaction modes (zoom, drawing, pan) are implemented in PlotInteraction.
Each interaction mode is implemented with a state machine structure (implemented in Interaction).
The different events emitted by Plot and by the interaction modes are created with helper functions defined in PlotEvents.
The PlotWindow uses additional widgets:
CurvesROIWidgetto create regions of interest for curvesLegendSelectorto display a list of curves legends which provides some control on the curves (e.g., select, delete).MaskToolsWidgetto provide tools to draw a mask on an image.ScatterMaskToolsWidgetto provide tools to draw a mask on a scatter.The
PlotToolsmodule provides a set of additional widgets:PlotTools.PositionInfoPlotTools.LimitsToolBar
The
Profilemodule provides toolbar for extracting profiles from image and image stack:silx.gui.consoleto provide an IPython console which can control the plot area content.
The widgets also use the following miscellaneous modules:
_utils: utility functions
The backends package provide the implementation of the rendering used by the Plot.
It contains:
backends.BackendBase defines the API any plot backend should provide in BackendBase.
backends.BackendMatplotlib implements a matplotlib backend.
The backends.BackendMatplotlib the provides two classes:
BackendMatplotlibthat provides a matplotlib backend without a specific canvas.BackendMatplotlibQtwhich inherits fromBackendMatplotliband adds a Qt canvas, and Qt specific functionalities.
The OpenGL-based backend is implemented in the backends.BackendOpenGL module and
the backends.glutils package which provides the different primitives used for rendering and interaction.
It is based on silx.gui._glutils, PyOpenGL and OpenGL >= 2.1.
Modules#
For PlotWidget and Plot modules, see their respective documentations: PlotWidget, Plot.
The following modules are the modules used internally by the plot package.
backends.BackendBase#
Base class for Plot backends.
It documents the Plot backend API.
This API is a simplified version of PyMca PlotBackend API.
- class BackendBase(plot, parent=None)[source]#
Class defining the API a backend of the Plot should provide.
- addCurve(x, y, color, gapcolor, symbol, linewidth, linestyle, yaxis, xerror, yerror, fill, alpha, symbolsize, baseline)[source]#
Add a 1D curve given by x an y to the graph.
- Parameters:
x (numpy.ndarray) – The data corresponding to the x axis
y (numpy.ndarray) – The data corresponding to the y axis
color (string ("#RRGGBB") or (npoints, 4) unsigned byte array or one of the predefined color names defined in colors.py) – color(s) to be used
gapcolor (Union[str, None]) – color used to fill dashed line gaps.
symbol (str) –
Symbol to be drawn at each (x, y) position:
- ' ' or '' no symbol
- 'o' circle
- '.' point
- ',' pixel
- '+' cross
- 'x' x-cross
- 'd' diamond
- 's' square
linewidth (float) – The width of the curve in pixels
linestyle –
Type of line:
- ' ' or ''  no line
- '-'  solid line
- '--' dashed line
- '-.' dash-dot line
- ':'  dotted line
- (offset, (dash pattern))
yaxis (str) – The Y axis this curve belongs to in: ‘left’, ‘right’
xerror (numpy.ndarray or None) – Values with the uncertainties on the x values
yerror (numpy.ndarray or None) – Values with the uncertainties on the y values
fill (bool) – True to fill the curve, False otherwise
alpha (float) – Curve opacity, as a float in [0., 1.]
symbolsize (float) – Size of the symbol (if any) drawn at each (x, y) position.
- Returns:
The handle used by the backend to univocally access the curve
- addImage(data, origin, scale, colormap, alpha)[source]#
Add an image to the plot.
- Parameters:
data (numpy.ndarray) – (nrows, ncolumns) data or (nrows, ncolumns, RGBA) ubyte array
origin (2-tuple of float) – (origin X, origin Y) of the data. Default: (0., 0.)
scale (2-tuple of float) – (scale X, scale Y) of the data. Default: (1., 1.)
colormap (Colormap) – Colormap object to use. Ignored if data is RGB(A).
alpha (float) – Opacity of the image, as a float in range [0, 1].
- Returns:
The handle used by the backend to univocally access the image
- addTriangles(x, y, triangles, color, alpha)[source]#
Add a set of triangles.
- Parameters:
x (numpy.ndarray) – The data corresponding to the x axis
y (numpy.ndarray) – The data corresponding to the y axis
triangles (numpy.ndarray) – The indices to make triangles as a (Ntriangle, 3) array
color (numpy.ndarray) – color(s) as (npoints, 4) array
alpha (float) – Opacity as a float in [0., 1.]
- Returns:
The triangles’ unique identifier used by the backend
- addShape(x, y, shape, color, fill, overlay, linestyle, linewidth, gapcolor)[source]#
Add an item (i.e. a shape) to the plot.
- Parameters:
x (numpy.ndarray) – The X coords of the points of the shape
y (numpy.ndarray) – The Y coords of the points of the shape
shape (str) – Type of item to be drawn in hline, polygon, rectangle, vline, polylines
color (str) – Color of the item
fill (bool) – True to fill the shape
overlay (bool) – True if item is an overlay, False otherwise
linestyle –
Style of the line. Only relevant for line markers where X or Y is None. Value in:
’ ‘ no line
’-’ solid line
’–’ dashed line
’-.’ dash-dot line
’:’ dotted line
(offset, (dash pattern))
linewidth (float) – Width of the line. Only relevant for line markers where X or Y is None.
gapcolor (str) – Background color of the line, e.g., ‘blue’, ‘b’, ‘#FF0000’. It is used to draw dotted line using a second color.
- Returns:
The handle used by the backend to univocally access the item
- addMarker(x, y, text, color, symbol, symbolsize, linestyle, linewidth, constraint, yaxis, font, bgcolor)[source]#
Add a point, vertical line or horizontal line marker to the plot.
- Parameters:
x (
float|None) – Horizontal position of the marker in graph coordinates. If None, the marker is a horizontal line.y (
float|None) – Vertical position of the marker in graph coordinates. If None, the marker is a vertical line.text (
str|None) – Text associated to the marker (or None for no text)color (
str) – Color to be used for instance ‘blue’, ‘b’, ‘#FF0000’bgcolor (
tuple[float,float,float,float] |None) – Text background color to be used for instance ‘blue’, ‘b’, ‘#FF0000’symbol (
str|None) –Symbol representing the marker. Only relevant for point markers where X and Y are not None. Value in:
’o’ circle
’.’ point
’,’ pixel
’+’ cross
’x’ x-cross
’d’ diamond
’s’ square
linestyle (
str|tuple[float,tuple[float,...] |None]) –Style of the line. Only relevant for line markers where X or Y is None. Value in:
’ ‘ no line
’-’ solid line
’–’ dashed line
’-.’ dash-dot line
’:’ dotted line
(offset, (dash pattern))
linewidth (
float) – Width of the line. Only relevant for line markers where X or Y is None.constraint (
Callable[[float,float],tuple[float,float]] |None) – A function filtering marker displacement by dragging operations or None for no filter. This function is called each time a marker is moved. It takes the coordinates of the current cursor position in the plot as input and that returns the filtered coordinates.yaxis (
str) – The Y axis this marker belongs to in: ‘left’, ‘right’font (
QFont) – QFont to use to render textsymbolsize (
float)
- Return type:
object- Returns:
Handle used by the backend to univocally access the marker
- remove(item)[source]#
Remove an existing item from the plot.
- Parameters:
item – A backend specific item handle returned by a add* method
- setGraphCursorShape(cursor)[source]#
Set the cursor shape.
To override in interactive backends.
- Parameters:
cursor (str) – Name of the cursor shape or None
- setGraphCursor(flag, color, linewidth, linestyle)[source]#
Toggle the display of a crosshair cursor and set its attributes.
To override in interactive backends.
- Parameters:
flag (bool) – Toggle the display of a crosshair cursor.
color (A string (either a predefined color name in colors.py or "#RRGGBB")) or a 4 columns unsigned byte array.) – The color to use for the crosshair.
linewidth (int) – The width of the lines of the crosshair.
linestyle (None, one of the predefined styles or (offset, (dash pattern)).) –
Type of line:
- ' ' no line
- '-' solid line
- '--' dashed line
- '-.' dash-dot line
- ':' dotted line
- (offset, (dash pattern))
- getItemsFromBackToFront(condition=None)[source]#
Returns the list of plot items order as rendered by the backend.
This is the order used for rendering. By default, it takes into account overlays, z value and order of addition of items, but backends can override it.
- Parameters:
condition (callable) – Callable taking an item as input and returning False for items to skip. If None (default), no item is skipped.
- Return type:
List[Item]
- pickItem(x, y, item)[source]#
Return picked indices if any, or None.
- Parameters:
x (float) – The x pixel coord where to pick.
y (float) – The y pixel coord where to pick.
item – A backend item created with add* methods.
- Returns:
None if item was not picked, else returns picked indices information.
- Return type:
Union[None,List]
- setCurveColor(curve, color)[source]#
Set the color of a curve.
- Parameters:
curve – The curve handle
color (str) – The color to use.
- saveGraph(fileName, fileFormat, dpi)[source]#
Save the graph to a file (or a StringIO)
At least “png”, “svg” are supported.
- Parameters:
fileName (String or StringIO or BytesIO) – Destination
fileFormat (str) – String specifying the format
dpi (int) – The resolution to use or None.
- setGraphTitle(title)[source]#
Set the main title of the plot.
- Parameters:
title (str) – Title associated to the plot
- setGraphXLabel(label)[source]#
Set the X axis label.
- Parameters:
label (str) – label associated to the plot bottom X axis
- setGraphYLabel(label, axis)[source]#
Set the left Y axis label.
- Parameters:
label (str) – label associated to the plot left Y axis
axis (str) – The axis for which to get the limits: left or right
- setLimits(xmin, xmax, ymin, ymax, y2min=None, y2max=None)[source]#
Set the limits of the X and Y axes at once.
- Parameters:
xmin (float) – minimum bottom axis value
xmax (float) – maximum bottom axis value
ymin (float) – minimum left axis value
ymax (float) – maximum left axis value
y2min (float) – minimum right axis value
y2max (float) – maximum right axis value
- getGraphXLimits()[source]#
Get the graph X (bottom) limits.
- Returns:
Minimum and maximum values of the X axis
- setGraphXLimits(xmin, xmax)[source]#
Set the limits of X axis.
- Parameters:
xmin (float) – minimum bottom axis value
xmax (float) – maximum bottom axis value
- getGraphYLimits(axis)[source]#
Get the graph Y (left) limits.
- Parameters:
axis (str) – The axis for which to get the limits: left or right
- Returns:
Minimum and maximum values of the Y axis
- setGraphYLimits(ymin, ymax, axis)[source]#
Set the limits of the Y axis.
- Parameters:
ymin (float) – minimum left axis value
ymax (float) – maximum left axis value
axis (str) – The axis for which to get the limits: left or right
- getXAxisTimeZone()[source]#
Returns tzinfo that is used if the X-Axis plots date-times.
None means the datetimes are interpreted as local time.
- Return type:
datetime.tzinfo of None.
- setXAxisTimeZone(tz)[source]#
Sets tzinfo that is used if the X-Axis plots date-times.
Use None to let the datetimes be interpreted as local time.
- Return type:
datetime.tzinfo of None.
- isXAxisTimeSeries()[source]#
Return True if the X-axis scale shows datetime objects.
- Return type:
bool
- setXAxisTimeSeries(isTimeSeries)[source]#
Set whether the X-axis is a time series
- Parameters:
flag (bool) – True to switch to time series, False for regular axis.
- setXAxisLogarithmic(flag)[source]#
Set the X axis scale between linear and log.
- Parameters:
flag (bool) – If True, the bottom axis will use a log scale
- setYAxisLogarithmic(flag)[source]#
Set the Y axis scale between linear and log.
- Parameters:
flag (bool) – If True, the left axis will use a log scale
- setXAxisInverted(flag)[source]#
Invert the X axis.
- Parameters:
flag (
bool) – If True, put the horizontal axis origin on the right
- setYAxisInverted(flag)[source]#
Invert the Y axis.
- Parameters:
flag (bool) – If True, put the vertical axis origin on the top
- isYRightAxisVisible()[source]#
Return True if the Y axis on the right side of the plot is visible
- Return type:
bool
- setKeepDataAspectRatio(flag)[source]#
Set whether to keep data aspect ratio or not.
- Parameters:
flag (Boolean, default True) – True to respect data aspect ratio
- setGraphGrid(which)[source]#
Set grid.
- Parameters:
which – None to disable grid, ‘major’ for major grid, ‘both’ for major and minor grid
- dataToPixel(x, y, axis)[source]#
Convert a position in data space to a position in pixels in the widget.
- Parameters:
x (float or sequence of float) – The X coordinate in data space.
y (float or sequence of float) – The Y coordinate in data space.
axis (str) – The Y axis to use for the conversion (‘left’ or ‘right’).
- Returns:
The corresponding position in pixels or None if the data position is not in the displayed area.
- Return type:
A tuple of 2 floats: (xPixel, yPixel) or None.
- pixelToData(x, y, axis)[source]#
Convert a position in pixels in the widget to a position in the data space.
- Parameters:
x (float) – The X coordinate in pixels.
y (float) – The Y coordinate in pixels.
axis (str) – The Y axis to use for the conversion (‘left’ or ‘right’).
- Returns:
The corresponding position in data space or None if the pixel position is not in the plot area.
- Return type:
A tuple of 2 floats: (xData, yData) or None.
- getPlotBoundsInPixels()[source]#
Plot area bounds in widget coordinates in pixels.
- Returns:
bounds as a 4-tuple of int: (left, top, width, height)
- setAxesMargins(left, top, right, bottom)[source]#
Set the size of plot margins as ratios.
Values are expected in [0., 1.]
- Parameters:
left (
float)top (
float)right (
float)bottom (
float)
CurvesROIWidget#
Widget to handle regions of interest (ROI) on curves displayed in a
PlotWindow.
This widget is meant to work with PlotWindow.
- class CurvesROIWidget(parent=None, name=None, plot=None)[source]
Widget displaying a table of ROI information.
Implements also the following behavior:
if the roiTable has no ROI when showing create the default ICR one
- Parameters:
parent – See
QWidgetname (str) – The title of this widget
- sigROIWidgetSignal
Signal of ROIs modifications.
Modification information if given as a dict with an ‘event’ key providing the type of events.
Type of events:
AddROI, DelROI, LoadROI and ResetROI with keys: ‘roilist’, ‘roidict’
selectionChanged with keys: ‘row’, ‘col’ ‘roi’, ‘key’, ‘colheader’, ‘rowheader’
- getPlotWidget()[source]
Returns the associated PlotWidget or None
- Return type:
Union[PlotWidget,None]
- property roiFileDir
The directory from which to load/save ROI from/to files.
- load(filename)[source]
Load ROI widget information from a file storing a dict of ROI.
- Parameters:
filename (str) – The file from which to load ROI
- save(filename)[source]
Save current ROIs of the widget as a dict of ROI to a file.
- Parameters:
filename (str) – The file to which to save the ROIs
- setHeader(text='ROIs')[source]
Set the header text of this widget
- calculateRois(roiList=None, roiDict=None)[source]
Compute ROI information
- class ROITable(parent=None, plot=None, rois=None)[source]
Table widget displaying ROI information.
See
QTableWidgetfor constructor arguments.Behavior: listen at the active curve changed only when the widget is visible. Otherwise won’t compute the row and net counts…
- activeROIChanged
Signal emitted when the active roi changed or when the value of the active roi are changing
- clear()[source]
Note
clear the interface only. keep the roidict…
- setRois(rois, order=None)[source]
Set the ROIs by providing a dictionary of ROI information.
The dictionary keys are the ROI names. Each value is a sub-dictionary of ROI info with the following fields:
"from": x coordinate of the left limit, as a float"to": x coordinate of the right limit, as a float"type": type of ROI, as a string (e.g “channels”, “energy”)
- Parameters:
roidict – Dictionary of ROIs
order (str) – Field used for ordering the ROIs. One of “from”, “to”, “type”. None (default) for no ordering, or same order as specified in parameter
roisif provided as a dict.
- deleteActiveRoi()[source]
remove the current active roi
- removeROI(roi)[source]
remove the requested roi
- Parameters:
name (str) – the name of the roi to remove from the table
- setActiveRoi(roi)[source]
Define the given roi as the active one.
Warning
this roi should already be registred / added to the table
:param
ROIroi: the roi to defined as active
- calculateRois()[source]
Update values of all registred rois (raw and net counts in particular)
- getRois(order)[source]
Return the currently defined ROIs, as an ordered dict.
The dictionary keys are the ROI names. Each value is a
ROIobject..- Parameters:
order – Field used for ordering the ROIs. One of “from”, “to”, “type”, “netcounts”, “rawcounts”. None (default) to get the same order as displayed in the widget.
- Returns:
Ordered dictionary of ROI information
- save(filename)[source]
Save current ROIs of the widget as a dict of ROI to a file.
- Parameters:
filename (str) – The file to which to save the ROIs
- load(filename)[source]
Load ROI widget information from a file storing a dict of ROI.
- Parameters:
filename (str) – The file from which to load ROI
- showAllMarkers(_show=True)[source]
- Parameters:
_show (bool) – if true show all the markers of all the ROIs boundaries otherwise will only show the one of the active ROI.
- setMiddleROIMarkerFlag(flag=True)[source]
Activate or deactivate middle marker.
This allows shifting both min and max limits at once, by dragging a marker located in the middle.
- Parameters:
flag (bool) – True to activate middle ROI marker
- setCountsVisible(visible)[source]
Display the columns relative to areas or not
- Parameters:
visible (bool) – True if the columns ‘Raw Area’ and ‘Net Area’ should be visible.
- setAreaVisible(visible)[source]
Display the columns relative to areas or not
- Parameters:
visible (bool) – True if the columns ‘Raw Area’ and ‘Net Area’ should be visible.
- fillFromROIDict(roilist=(), roidict=None, currentroi=None)[source]
This function API is kept for compatibility. But setRois should be preferred.
Set the ROIs by providing a list of ROI names and a dictionary of ROI information for each ROI. The ROI names must match an existing dictionary key. The name list is used to provide an order for the ROIs. The dictionary’s values are sub-dictionaries containing 3 mandatory fields:
"from": x coordinate of the left limit, as a float"to": x coordinate of the right limit, as a float"type": type of ROI, as a string (e.g “channels”, “energy”)
- Parameters:
roilist (List) – List of ROI names (keys of roidict)
roidict (dict) – Dict of ROI information
currentroi – Name of the selected ROI or None (no selection)
- class ROI(name, fromdata=None, todata=None, type_=None)[source]
The Region Of Interest is defined by:
A name
A type. The type is the label of the x axis. This can be used to apply or not some ROI to a curve and do some post processing.
The x coordinate of the left limit (fromdata)
The x coordinate of the right limit (todata)
- Parameters:
str – name of the ROI
fromdata – left limit of the roi
todata – right limit of the roi
type – type of the ROI
- sigChanged
Signal emitted when the ROI is edited
- getID()[source]
- Return int:
the unique ID of the ROI
- setType(type_)[source]
- Parameters:
type (str)
- getType()[source]
- Return str:
the type of the ROI.
- setFrom(frm)[source]
- Parameters:
frm – set x coordinate of the left limit
- getFrom()[source]
- Returns:
x coordinate of the left limit
- setTo(to)[source]
- Parameters:
to – x coordinate of the right limit
- getTo()[source]
- Returns:
x coordinate of the right limit
- getMiddle()[source]
- Returns:
middle position between ‘from’ and ‘to’ values
- toDict()[source]
- Returns:
dict containing the roi parameters
- isICR()[source]
- Returns:
True if the ROI is the ICR
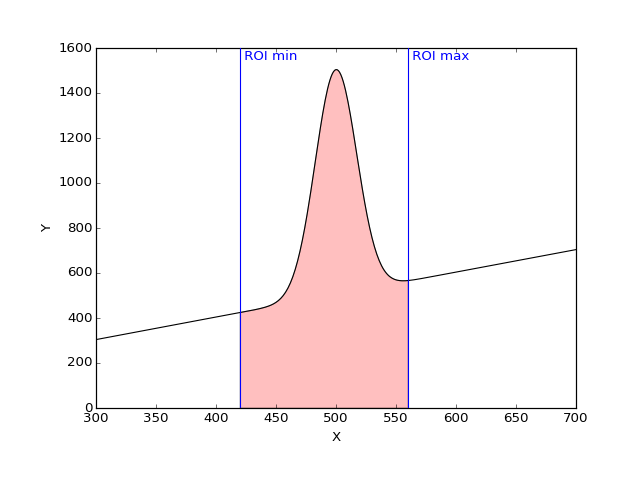
- computeRawAndNetCounts(curve)[source]
Compute the Raw and net counts in the ROI for the given curve.
- Raw count: Points values sum of the curve in the defined Region Of
Interest.
Net count: Raw counts minus background
- Parameters:
curve (CurveItem)
- Return tuple:
rawCount, netCount
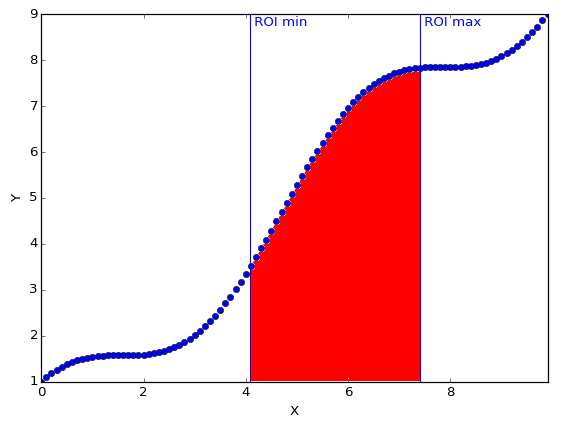
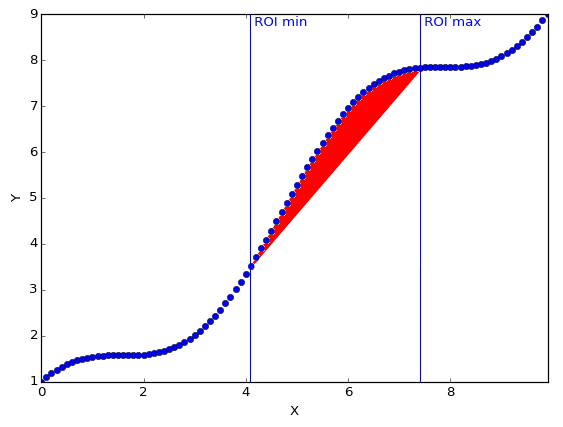
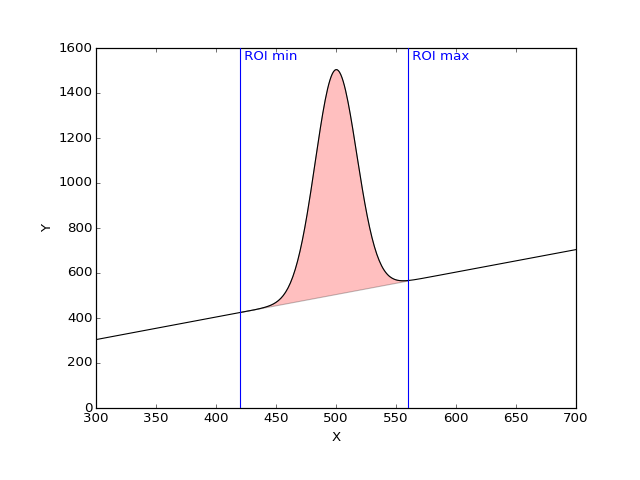
- computeRawAndNetArea(curve)[source]
Compute the Raw and net counts in the ROI for the given curve.
- Raw area: integral of the curve between the min ROI point and the
max ROI point to the y = 0 line.
Net area: Raw counts minus background
- Parameters:
curve (CurveItem)
- Return tuple:
rawArea, netArea
- contains(position)[source]
Check which positions are inside the ROI.
- Parameters:
position (
TypeAliasType) – array-like of positions, where each position is given as(x, y). If multiple positions are provided, the shape should be(N, 2). For a single position, the shape should be(2,).- Return type:
Union[bool,ndarray]- Returns:
boolean or boolean array of shape
(N,), True if the point is inside the ROI.
- class CurvesROIDockWidget(parent=None, plot=None, name=None)[source]
QDockWidget with a
CurvesROIWidgetconnected to a PlotWindow.It makes the link between the
CurvesROIWidgetand the PlotWindow.- Parameters:
parent – See
QDockWidgetplot –
PlotWindowinstance on which to operatename – See
QDockWidget
- roiWidget
Main widget of type
CurvesROIWidget
- toggleViewAction()[source]
Returns a checkable action that shows or closes this widget.
See
QMainWindow.
Interaction#
This module provides an implementation of state machines for interaction.
Sample code of a state machine with two states (‘idle’ and ‘active’) with transitions on left button press/release:
from silx.gui.plot.Interaction import *

class SampleStateMachine(StateMachine):

    class Idle(State):
        def onPress(self, x, y, btn):
            if btn == LEFT_BTN:
                self.goto('active')

    class Active(State):
        def enterState(self):
            print('Enabled')  # Handle enter active state here

        def leaveState(self):
            print('Disabled')  # Handle leave active state here

        def onRelease(self, x, y, btn):
            if btn == LEFT_BTN:
                self.goto('idle')

def __init__(self):
    # State machine has 2 states
    states = {
        'idle': SampleStateMachine.Idle,
        'active': SampleStateMachine.Active
    }
    super(TwoStates, self).__init__(states, 'idle')
    # idle is the initial state

stateMachine = SampleStateMachine()

# Triggers a transition to the Active state:
stateMachine.handleEvent('press', 0, 0, LEFT_BTN)

# Triggers a transition to the Idle state:
stateMachine.handleEvent('release', 0, 0, LEFT_BTN)
See ClickOrDrag for another example of a state machine.
See Renaud Blanch, Michel Beaudouin-Lafon. Programming Rich Interactions using the Hierarchical State Machine Toolkit. In Proceedings of AVI 2006. p 51-58. for a discussion of using (hierarchical) state machines for interaction.
- class State(machine)[source]#
Base class for the states of a state machine.
This class is meant to be subclassed.
- property machine#
The state machine this state belongs to.
Useful to access data or methods that are shared across states.
- goto(state, *args, **kwargs)[source]#
Performs a transition to a new state.
Extra arguments are passed to the
enterState()method of the new state.- Parameters:
state (str) – The name of the state to go to.
- enterState(*args, **kwargs)[source]#
Called when the state machine enters this state.
Arguments are those provided to the
goto()method that triggered the transition to this state.
- class StateMachine(states, initState, *args, **kwargs)[source]#
State machine controller.
This is the entry point of a state machine. It is in charge of dispatching received event and handling the current active state.
- handleEvent(eventName, *args, **kwargs)[source]#
Process an event with the state machine.
This method looks up for an event handler in the current state and then in the
StateMachineinstance. Handler are looked up as ‘onEventName’ method. If a handler is found, it is called with the provided extra arguments, and this method returns the return value of the handler. If no handler is found, this method returns None.- Parameters:
eventName (str) – Name of the event to handle
- Returns:
The return value of the handler or None
- LEFT_BTN = 'left'#
Left mouse button.
- RIGHT_BTN = 'right'#
Right mouse button.
- MIDDLE_BTN = 'middle'#
Middle mouse button.
- class ClickOrDrag(clickButtons=('left', 'right'), dragButtons=('left',))[source]#
State machine for left and right click and left drag interaction.
It is intended to be used through subclassing by overriding
click(),beginDrag(),drag()andendDrag().- Parameters:
clickButtons (Set[str]) – Set of buttons that provides click interaction
dragButtons (Set[str]) – Set of buttons that provides drag interaction
- property clickButtons#
Buttons with click interaction (Set[int])
- property dragButtons#
Buttons with drag interaction (Set[int])
- click(x, y, btn)[source]#
Called upon a button supporting click.
Override in subclass.
- Parameters:
x (int) – X mouse position in pixels.
y (int) – Y mouse position in pixels.
btn (str) – The mouse button which was clicked.
- beginDrag(x, y, btn)[source]#
Called at the beginning of a drag gesture with mouse button pressed.
Override in subclass.
- Parameters:
x (int) – X mouse position in pixels.
y (int) – Y mouse position in pixels.
btn (str) – The mouse button for which a drag is starting.
- drag(x, y, btn)[source]#
Called on mouse moved during a drag gesture.
Override in subclass.
- Parameters:
x (int) – X mouse position in pixels.
y (int) – Y mouse position in pixels.
btn (str) – The mouse button for which a drag is in progress.
- endDrag(startPoint, endPoint, btn)[source]#
Called at the end of a drag gesture when the mouse button is released.
Override in subclass.
- Parameters:
startPoint (List[int]) – (x, y) mouse position in pixels at the beginning of the drag.
endPoint (List[int]) – (x, y) mouse position in pixels at the end of the drag.
btn (str) – The mouse button for which a drag is done.
LegendSelector#
Widget displaying curves legends and allowing to operate on curves.
This widget is meant to work with PlotWindow.
- class LegendIcon(parent=None, curve=None)[source]#
Object displaying a curve linestyle and symbol.
- Parameters:
parent (QWidget) – See
QWidgetcurve (Union[Curve,None]) – Curve with which to synchronize
- class LegendModel(legendList=None, parent=None)[source]#
Data model of curve legends.
It holds the information of the curve:
color
line width
line style
visibility of the lines
symbol
visibility of the symbols
- class LegendListItemWidget(parent=None, itemType=0)[source]#
Object displaying a single item (i.e., a row) in the list.
- class LegendListView(parent=None, model=None, contextMenu=None)[source]#
Widget displaying a list of curve legends, line style and symbol.
- sigLegendSignal#
Signal emitting a dict when an action is triggered by the user.
- class LegendListContextMenu(model)[source]#
Contextual menu associated to items in a
LegendListView.- sigContextMenu#
Signal emitting a dict upon contextual menu actions.
- class RenameCurveDialog(parent=None, current='', curves=())[source]#
Dialog box to input the name of a curve.
- class LegendsDockWidget(parent=None, plot=None)[source]#
QDockWidget with a
LegendSelectorconnected to a PlotWindow.It makes the link between the LegendListView widget and the PlotWindow.
- Parameters:
parent – See
QDockWidgetplot –
PlotWindowinstance on which to operate
- property plot#
The
PlotWindowthis widget is attached to.
_BaseMaskToolsWidget#
This module is a collection of base classes used in modules
MaskToolsWidget (images) and ScatterMaskToolsWidget
- class BaseMask(dataItem=None)[source]#
Base class for
ImageMaskandScatterMaskA mask field with update operations.
A mask is an array of the same shape as some underlying data. The mask array stores integer values in the range 0-255, to allow for 254 levels of mask (value 0 is reserved for unmasked data).
The mask is updated using spatial selection methods: data located inside a selected area is masked with a specified mask level.
- sigChanged#
Signal emitted when the mask has changed
- sigStateChanged#
Signal emitted for each mask commit/undo/redo operation
- sigUndoable#
Signal emitted when undo becomes possible/impossible
- sigRedoable#
Signal emitted when redo becomes possible/impossible
- historyDepth#
Maximum number of operation stored in history list for undo
- setDataItem(item)[source]#
Set a data item
- Parameters:
item – A plot item, subclass of
silx.gui.plot.items.Item- Returns:
- getDataValues()[source]#
Return data values, as a numpy array with the same shape as the mask.
This method must be implemented in a subclass, as the way of accessing data depends on the data item passed to
setDataItem()- Returns:
Data values associated with the data item.
- Return type:
numpy.ndarray
- getMask(copy=True)[source]#
Get the current mask as a numpy array.
- Parameters:
copy (bool) – True (default) to get a copy of the mask. If False, the returned array MUST not be modified.
- Returns:
The array of the mask with dimension of the data to be masked.
- Return type:
numpy.ndarray of uint8
- setMask(mask, copy=True)[source]#
Set the mask to a new array.
- Parameters:
mask (numpy.ndarray of uint8, C-contiguous. Array of other types are converted.) – The array to use for the mask.
copy (bool) – True (the default) to copy the array, False to use it as is if possible.
- clear(level)[source]#
Set all values of the given mask level to 0.
- Parameters:
level (int) – Value of the mask to set to 0.
- invert(level)[source]#
Invert mask of the given mask level.
0 values become level and level values become 0.
- Parameters:
level (int) – The level to invert.
- reset(shape=None)[source]#
Reset the mask to zero and change its shape.
- Parameters:
shape (tuple of int) – Shape of the new mask with the correct dimensionality with regards to the data dimensionality, or None to have an empty mask
- save(filename, kind)[source]#
Save current mask in a file
- Parameters:
filename (str) – The file where to save to mask
kind (str) – The kind of file to save (e.g ‘npy’)
- Raises:
Exception – Raised if the file writing fail
- updateStencil(level, stencil, mask=True)[source]#
Mask/Unmask points from boolean mask: all elements that are True in the boolean mask are set to
level(ifmask=True) or 0 (ifmask=False)- Parameters:
level (int) – Mask level to update.
stencil (numpy.array of same dimension as the mask) – Boolean mask.
mask (bool) – True to mask (default), False to unmask.
- updateBelowThreshold(level, threshold, mask=True)[source]#
Mask/unmask all points whose values are below a threshold.
- Parameters:
level (int)
threshold (float) – Threshold
mask (bool) – True to mask (default), False to unmask.
- updateBetweenThresholds(level, min_, max_, mask=True)[source]#
Mask/unmask all points whose values are in a range.
- Parameters:
level (int)
min (float) – Lower threshold
max (float) – Upper threshold
mask (bool) – True to mask (default), False to unmask.
- updateAboveThreshold(level, threshold, mask=True)[source]#
Mask/unmask all points whose values are above a threshold.
- Parameters:
level (int) – Mask level to update.
threshold (float) – Threshold.
mask (bool) – True to mask (default), False to unmask.
- updateNotFinite(level, mask=True)[source]#
Mask/unmask all points whose values are not finite.
- Parameters:
level (int) – Mask level to update.
mask (bool) – True to mask (default), False to unmask.
- updateRectangle(level, row, col, height, width, mask=True)[source]#
Mask/Unmask data inside a rectangle, with the given mask level.
- Parameters:
level (int) – Mask level to update, in range 1-255.
row – Starting row/y of the rectangle
col – Starting column/x of the rectangle
height
width
mask (bool) – True to mask (default), False to unmask.
- updatePolygon(level, vertices, mask=True)[source]#
Mask/Unmask data inside a polygon, with the given mask level.
- Parameters:
level (int) – Mask level to update.
vertices – Nx2 array of polygon corners as (row, col) / (y, x)
mask (bool) – True to mask (default), False to unmask.
- updatePoints(level, rows, cols, mask=True)[source]#
Mask/Unmask points with given coordinates.
- Parameters:
level (int) – Mask level to update.
rows (1D numpy.ndarray) – Rows/ordinates (y) of selected points
cols (1D numpy.ndarray) – Columns/abscissa (x) of selected points
mask (bool) – True to mask (default), False to unmask.
- updateDisk(level, crow, ccol, radius, mask=True)[source]#
Mask/Unmask data located inside a dick of the given mask level.
- Parameters:
level (int) – Mask level to update.
crow – Disk center row/ordinate (y).
ccol – Disk center column/abscissa.
radius (float) – Radius of the disk in mask array unit
mask (bool) – True to mask (default), False to unmask.
- updateEllipse(level, crow, ccol, radius_r, radius_c, mask=True)[source]#
Mask/Unmask a disk of the given mask level.
- Parameters:
level (int) – Mask level to update.
crow (int) – Row of the center of the ellipse
ccol (int) – Column of the center of the ellipse
radius_r (float) – Radius of the ellipse in the row
radius_c (float) – Radius of the ellipse in the column
mask (bool) – True to mask (default), False to unmask.
- updateLine(level, row0, col0, row1, col1, width, mask=True)[source]#
Mask/Unmask a line of the given mask level.
- Parameters:
level (int) – Mask level to update.
row0 – Row/y of the starting point.
col0 – Column/x of the starting point.
row1 – Row/y of the end point.
col1 – Column/x of the end point.
width – Width of the line in mask array unit.
mask (bool) – True to mask (default), False to unmask.
- class BaseMaskToolsWidget(parent=None, plot=None, mask=None)[source]#
Base class for
MaskToolsWidget(image mask) andscatterMaskToolsWidget- getMaskedItem()[source]#
Returns the item that is currently being masked
- Return type:
Union[Item,None]
- getSelectionMask(copy=True)[source]#
Get the current mask as a numpy array.
- Parameters:
copy (bool) – True (default) to get a copy of the mask. If False, the returned array MUST not be modified.
- Returns:
The mask (as an array of uint8) with dimension of the ‘active’ plot item. If there is no active image or scatter, it returns None.
- Return type:
Union[numpy.ndarray,None]
- setMultipleMasks(mode)[source]#
Set the mode of multiple masks support.
Available modes:
‘single’: Edit a single level of mask
‘exclusive’: Supports to 256 levels of non overlapping masks
- Parameters:
mode (str) – The mode to use
- setMaskFileDirectory(path)[source]#
Set the default directory to use by load/save GUI tools
The directory is also updated by the user, if he change the location of the dialog.
- property maskFileDir#
The directory from which to load/save mask from/to files.
- property plot#
The
PlotWindowthis widget is attached to.
- setDirection(direction=Direction.LeftToRight)[source]#
Set the direction of the layout of the widget
- Parameters:
direction – QBoxLayout direction
- save(filename, kind)[source]#
Save current mask in a file
- Parameters:
filename (str) – The file where to save to mask
kind (str) – The kind of file to save in ‘edf’, ‘tif’, ‘npy’
- Raises:
Exception – Raised if the process fails
- getCurrentMaskColor()[source]#
Returns the color of the current selected level.
- Return type:
A tuple or a python array
- resetMaskColors(level=None)[source]#
Reset the mask color at the given level to be defaultColors
- Parameters:
level – The index of the mask for which we want to reset the color. If none we will reset color for all masks.
- class BaseMaskToolsDockWidget(parent=None, name='Mask', widget=None)[source]#
Base class for
MaskToolsWidgetandScatterMaskToolsWidget.For integration in a
PlotWindow.- Parameters:
parent – See
QDockWidget- Paran str name:
The title of this widget
- getSelectionMask(copy=True)[source]#
Get the current mask as a 2D array.
- Parameters:
copy (bool) – True (default) to get a copy of the mask. If False, the returned array MUST not be modified.
- Returns:
The array of the mask with dimension of the ‘active’ image. If there is no active image, an empty array is returned.
- Return type:
2D numpy.ndarray of uint8
- setSelectionMask(mask, copy=True)[source]#
Set the mask to a new array.
- Parameters:
mask (numpy.ndarray of uint8 of dimension 2, C-contiguous. Array of other types are converted.) – The array to use for the mask.
copy (bool) – True (the default) to copy the array, False to use it as is if possible.
- Returns:
None if failed, shape of mask as 2-tuple if successful. The mask can be cropped or padded to fit active image, the returned shape is that of the active image.
MaskToolsWidget#
Widget providing a set of tools to draw masks on a PlotWidget.
This widget is meant to work with silx.gui.plot.PlotWidget.
ImageMask: Handle mask bitmap update and historyMaskToolsWidget: GUI forMaskMaskToolsDockWidget: DockWidget to integrate inPlotWindow
- class ImageMask(image=None)[source]#
Bases:
BaseMaskA 2D mask field with update operations.
Coords follows (row, column) convention and are in mask array coords.
This is meant for internal use by
MaskToolsWidget.- getDataValues()[source]#
Return image data as a 2D or 3D array (if it is a RGBA image).
- Return type:
2D or 3D numpy.ndarray
- save(filename, kind)[source]#
Save current mask in a file
- Parameters:
filename (str) – The file where to save to mask
kind (str) – The kind of file to save in ‘edf’, ‘tif’, ‘npy’, ‘h5’ or ‘msk’ (if FabIO is installed)
- Raises:
Exception – Raised if the file writing fail
- updateRectangle(level, row, col, height, width, mask=True)[source]#
Mask/Unmask a rectangle of the given mask level.
- Parameters:
level (int) – Mask level to update.
row (int) – Starting row of the rectangle
col (int) – Starting column of the rectangle
height (int)
width (int)
mask (bool) – True to mask (default), False to unmask.
- updatePolygon(level, vertices, mask=True)[source]#
Mask/Unmask a polygon of the given mask level.
- Parameters:
level (int) – Mask level to update.
vertices – Nx2 array of polygon corners as (row, col)
mask (bool) – True to mask (default), False to unmask.
- updatePoints(level, rows, cols, mask=True)[source]#
Mask/Unmask points with given coordinates.
- Parameters:
level (int) – Mask level to update.
rows (1D numpy.ndarray) – Rows of selected points
cols (1D numpy.ndarray) – Columns of selected points
mask (bool) – True to mask (default), False to unmask.
- updateDisk(level, crow, ccol, radius, mask=True)[source]#
Mask/Unmask a disk of the given mask level.
- Parameters:
level (int) – Mask level to update.
crow (int) – Disk center row.
ccol (int) – Disk center column.
radius (float) – Radius of the disk in mask array unit
mask (bool) – True to mask (default), False to unmask.
- updateEllipse(level, crow, ccol, radius_r, radius_c, mask=True)[source]#
Mask/Unmask an ellipse of the given mask level.
- Parameters:
level (int) – Mask level to update.
crow (int) – Row of the center of the ellipse
ccol (int) – Column of the center of the ellipse
radius_r (float) – Radius of the ellipse in the row
radius_c (float) – Radius of the ellipse in the column
mask (bool) – True to mask (default), False to unmask.
- updateLine(level, row0, col0, row1, col1, width, mask=True)[source]#
Mask/Unmask a line of the given mask level.
- Parameters:
level (int) – Mask level to update.
row0 (int) – Row of the starting point.
col0 (int) – Column of the starting point.
row1 (int) – Row of the end point.
col1 (int) – Column of the end point.
width (int) – Width of the line in mask array unit.
mask (bool) – True to mask (default), False to unmask.
- class MaskToolsWidget(parent=None, plot=None)[source]#
Bases:
BaseMaskToolsWidgetWidget with tools for drawing mask on an image in a PlotWidget.
By default, the mask authored with this widget is not updating the mask of the “active” image item. To enable this feature, use
setItemMaskUpdated()- setItemMaskUpdated(enabled)[source]#
Toggle item mask and mask tool synchronisation.
- Parameters:
enabled (
bool) – True to synchronise. Default: False- Return type:
None
- isItemMaskUpdated()[source]#
Returns whether or not item and mask tool masks are synchronised.
- Return type:
bool
- setSelectionMask(mask, copy=True)[source]#
Set the mask to a new array.
- Parameters:
mask (numpy.ndarray of uint8 of dimension 2, C-contiguous. Array of other types are converted.) – The array to use for the mask or None to reset the mask.
copy (bool) – True (the default) to copy the array, False to use it as is if possible.
- Returns:
None if failed, shape of mask as 2-tuple if successful. The mask can be cropped or padded to fit active image, the returned shape is that of the active image.
- class MaskToolsDockWidget(parent=None, plot=None, name='Mask')[source]#
Bases:
BaseMaskToolsDockWidgetMaskToolsWidgetembedded in a QDockWidget.For integration in a
PlotWindow.- Parameters:
parent – See
QDockWidgetplot – The PlotWidget this widget is operating on
- Paran str name:
The title of this widget
ScatterMaskToolsWidget#
Widget providing a set of tools to draw masks on a PlotWidget.
This widget is meant to work with a modified silx.gui.plot.PlotWidget
ScatterMask: Handle scatter mask update and historyScatterMaskToolsWidget: GUI forScatterMaskScatterMaskToolsDockWidget: DockWidget to integrate inPlotWindow
- class ScatterMask(scatter=None)[source]#
Bases:
BaseMaskA 1D mask for scatter data.
- save(filename, kind)[source]#
Save current mask in a file
- Parameters:
filename (str) – The file where to save to mask
kind (str) – The kind of file to save (e.g ‘npy’)
- Raises:
Exception – Raised if the file writing fail
- updatePoints(level, indices, mask=True)[source]#
Mask/Unmask points with given indices.
- Parameters:
level (int) – Mask level to update.
indices – Sequence or 1D array of indices of points to be updated
mask (bool) – True to mask (default), False to unmask.
- updatePolygon(level, vertices, mask=True)[source]#
Mask/Unmask a polygon of the given mask level.
- Parameters:
level (int) – Mask level to update.
vertices – Nx2 array of polygon corners as (y, x) or (row, col)
mask (bool) – True to mask (default), False to unmask.
- updateRectangle(level, y, x, height, width, mask=True)[source]#
Mask/Unmask data inside a rectangle
- Parameters:
level (int) – Mask level to update.
y (float) – Y coordinate of bottom left corner of the rectangle
x (float) – X coordinate of bottom left corner of the rectangle
height (float)
width (float)
mask (bool) – True to mask (default), False to unmask.
- updateDisk(level, cy, cx, radius, mask=True)[source]#
Mask/Unmask a disk of the given mask level.
- Parameters:
level (int) – Mask level to update.
cy (float) – Disk center (y).
cx (float) – Disk center (x).
radius (float) – Radius of the disk in mask array unit
mask (bool) – True to mask (default), False to unmask.
- updateEllipse(level, crow, ccol, radius_r, radius_c, mask=True)[source]#
Mask/Unmask an ellipse of the given mask level.
- Parameters:
level (int) – Mask level to update.
crow (int) – Row of the center of the ellipse
ccol (int) – Column of the center of the ellipse
radius_r (float) – Radius of the ellipse in the row
radius_c (float) – Radius of the ellipse in the column
mask (bool) – True to mask (default), False to unmask.
- updateLine(level, y0, x0, y1, x1, width, mask=True)[source]#
Mask/Unmask points inside a rectangle defined by a line (two end points) and a width.
- Parameters:
level (int) – Mask level to update.
y0 (float) – Row of the starting point.
x0 (float) – Column of the starting point.
row1 (float) – Row of the end point.
col1 (float) – Column of the end point.
width (float) – Width of the line.
mask (bool) – True to mask (default), False to unmask.
- class ScatterMaskToolsWidget(parent=None, plot=None)[source]#
Bases:
BaseMaskToolsWidgetWidget with tools for masking data points on a scatter in a
PlotWidget.- setSelectionMask(mask, copy=True)[source]#
Set the mask to a new array.
- Parameters:
mask (numpy.ndarray of uint8, C-contiguous. Array of other types are converted.) – The array to use for the mask or None to reset the mask.
copy (bool) – True (the default) to copy the array, False to use it as is if possible.
- Returns:
None if failed, shape of mask as 1-tuple if successful. The mask can be cropped or padded to fit active scatter, the returned shape is that of the scatter data.
- class ScatterMaskToolsDockWidget(parent=None, plot=None, name='Mask')[source]#
Bases:
BaseMaskToolsDockWidgetScatterMaskToolsWidgetembedded in a QDockWidget.For integration in a
PlotWindow.- Parameters:
parent – See
QDockWidgetplot – The PlotWidget this widget is operating on
- Paran str name:
The title of this widget
PlotEvents#
Functions to prepare events to be sent to Plot callback.
- prepareDrawingSignal(event, type_, points, parameters=None)[source]#
See Plot documentation for content of events
- prepareMouseSignal(eventType, button, xData, yData, xPixel, yPixel)[source]#
See Plot documentation for content of events
- prepareHoverSignal(label, type_, posData, posPixel, draggable, selectable)[source]#
See Plot documentation for content of events
- prepareMarkerSignal(eventType, button, label, type_, draggable, selectable, posDataMarker, posPixelCursor=None, posDataCursor=None)[source]#
See Plot documentation for content of events
- prepareImageSignal(button, item, col, row, x, y, xPixel, yPixel)[source]#
See Plot documentation for content of events
PlotInteraction#
Implementation of the interaction for the Plot.
- class Pan(plot, **kwargs)[source]#
Pan plot content and zoom on wheel state machine.
- beginDrag(x, y, btn)[source]#
Called at the beginning of a drag gesture with mouse button pressed.
Override in subclass.
- Parameters:
x (int) – X mouse position in pixels.
y (int) – Y mouse position in pixels.
btn (str) – The mouse button for which a drag is starting.
- drag(x, y, btn)[source]#
Called on mouse moved during a drag gesture.
Override in subclass.
- Parameters:
x (int) – X mouse position in pixels.
y (int) – Y mouse position in pixels.
btn (str) – The mouse button for which a drag is in progress.
- endDrag(startPos, endPos, btn)[source]#
Called at the end of a drag gesture when the mouse button is released.
Override in subclass.
- Parameters:
startPoint (List[int]) – (x, y) mouse position in pixels at the beginning of the drag.
endPoint (List[int]) – (x, y) mouse position in pixels at the end of the drag.
btn (str) – The mouse button for which a drag is done.
- class AxesExtent(xmin, xmax, ymin, ymax, y2min, y2max)[source]#
- Parameters:
xmin (
float)xmax (
float)ymin (
float)ymax (
float)y2min (
float)y2max (
float)
- xmin: float#
Alias for field number 0
- xmax: float#
Alias for field number 1
- ymin: float#
Alias for field number 2
- ymax: float#
Alias for field number 3
- y2min: float#
Alias for field number 4
- y2max: float#
Alias for field number 5
- class Zoom(plot, color)[source]#
Zoom-in/out state machine.
Zoom-in on selected area, zoom-out on right click, and zoom on mouse wheel.
- beginDrag(x, y, btn)[source]#
Called at the beginning of a drag gesture with mouse button pressed.
Override in subclass.
- Parameters:
x (int) – X mouse position in pixels.
y (int) – Y mouse position in pixels.
btn (str) – The mouse button for which a drag is starting.
- drag(x1, y1, btn)[source]#
Called on mouse moved during a drag gesture.
Override in subclass.
- Parameters:
x (int) – X mouse position in pixels.
y (int) – Y mouse position in pixels.
btn (str) – The mouse button for which a drag is in progress.
- endDrag(startPos, endPos, btn)[source]#
Called at the end of a drag gesture when the mouse button is released.
Override in subclass.
- Parameters:
startPoint (List[int]) – (x, y) mouse position in pixels at the beginning of the drag.
endPoint (List[int]) – (x, y) mouse position in pixels at the end of the drag.
btn (str) – The mouse button for which a drag is done.
- class SelectPolygon(plot, parameters)[source]#
Drawing selection polygon area state machine.
- class Select2Points(plot, parameters)[source]#
Base class for drawing selection based on 2 input points.
- class Select1Point(plot, parameters)[source]#
Base class for drawing selection area based on one input point.
- class SelectHLine(plot, parameters)[source]#
Drawing a horizontal line selection area state machine.
- class DrawFreeHand(plot, parameters)[source]#
Interaction for drawing pencil. It display the preview of the pencil before pressing the mouse.
- class SelectFreeLine(plot, parameters)[source]#
Base class for drawing free lines with tools such as pencil.
- click(x, y, btn)[source]#
Called upon a button supporting click.
Override in subclass.
- Parameters:
x (int) – X mouse position in pixels.
y (int) – Y mouse position in pixels.
btn (str) – The mouse button which was clicked.
- beginDrag(x, y, btn)[source]#
Called at the beginning of a drag gesture with mouse button pressed.
Override in subclass.
- Parameters:
x (int) – X mouse position in pixels.
y (int) – Y mouse position in pixels.
btn (str) – The mouse button for which a drag is starting.
- drag(x, y, btn)[source]#
Called on mouse moved during a drag gesture.
Override in subclass.
- Parameters:
x (int) – X mouse position in pixels.
y (int) – Y mouse position in pixels.
btn (str) – The mouse button for which a drag is in progress.
- endDrag(startPos, endPos, btn)[source]#
Called at the end of a drag gesture when the mouse button is released.
Override in subclass.
- Parameters:
startPoint (List[int]) – (x, y) mouse position in pixels at the beginning of the drag.
endPoint (List[int]) – (x, y) mouse position in pixels at the end of the drag.
btn (str) – The mouse button for which a drag is done.
- class ItemsInteraction(plot)[source]#
Interaction with items (markers, curves and images).
This class provides selection and dragging of plot primitives that support those interaction. It is also meant to be combined with the zoom interaction.
- click(x, y, btn)[source]#
Handle mouse click
- Parameters:
x – X position of the mouse in pixels
y – Y position of the mouse in pixels
btn – Pressed button id
- Returns:
True if click is catched by an item, False otherwise
- beginDrag(x, y, btn)[source]#
Handle begining of drag interaction
- Parameters:
x – X position of the mouse in pixels
y – Y position of the mouse in pixels
btn (str) – The mouse button for which a drag is starting.
- Returns:
True if drag is catched by an item, False otherwise
- drag(x, y, btn)[source]#
Called on mouse moved during a drag gesture.
Override in subclass.
- Parameters:
x (int) – X mouse position in pixels.
y (int) – Y mouse position in pixels.
btn (str) – The mouse button for which a drag is in progress.
- endDrag(startPos, endPos, btn)[source]#
Called at the end of a drag gesture when the mouse button is released.
Override in subclass.
- Parameters:
startPoint (List[int]) – (x, y) mouse position in pixels at the beginning of the drag.
endPoint (List[int]) – (x, y) mouse position in pixels at the end of the drag.
btn (str) – The mouse button for which a drag is done.
- class ItemsInteractionForCombo(plot)[source]#
Interaction with items to combine through
FocusManager.
- class FocusManager(eventHandlers=())[source]#
Manages focus across multiple event handlers
On press an event handler can acquire focus. By default it looses focus when all buttons are released.
- class ZoomAndSelect(plot, color)[source]#
Combine Zoom and ItemInteraction state machine.
- Parameters:
plot – The Plot to which this interaction is attached
color – The color to use for the zoom area bounding box
- property color#
Color of the zoom area
- property zoomEnabledAxes: EnabledAxes#
Whether or not to apply zoom for each axis
- click(x, y, btn)[source]#
Handle mouse click
- Parameters:
x – X position of the mouse in pixels
y – Y position of the mouse in pixels
btn – Pressed button id
- Returns:
True if click is catched by an item, False otherwise
- beginDrag(x, y, btn)[source]#
Handle start drag and switching between zoom and item drag.
- Parameters:
x – X position in pixels
y – Y position in pixels
btn (str) – The mouse button for which a drag is starting.
- class PanAndSelect(plot)[source]#
Combine Pan and ItemInteraction state machine.
- Parameters:
plot – The Plot to which this interaction is attached
- click(x, y, btn)[source]#
Handle mouse click
- Parameters:
x – X position of the mouse in pixels
y – Y position of the mouse in pixels
btn – Pressed button id
- Returns:
True if click is catched by an item, False otherwise
- beginDrag(x, y, btn)[source]#
Handle start drag and switching between zoom and item drag.
- Parameters:
x – X position in pixels
y – Y position in pixels
btn (str) – The mouse button for which a drag is starting.
- class DrawSelectMode(plot, shape, label, color, width)[source]#
Interactive mode for draw and select
- handleEvent(eventName, *args, **kwargs)[source]#
Process an event with the state machine.
This method looks up for an event handler in the current state and then in the
StateMachineinstance. Handler are looked up as ‘onEventName’ method. If a handler is found, it is called with the provided extra arguments, and this method returns the return value of the handler. If no handler is found, this method returns None.- Parameters:
eventName (str) – Name of the event to handle
- Returns:
The return value of the handler or None
- class PlotInteraction(parent)[source]#
PlotWidget user interaction handler.
- Parameters:
plot – The
PlotWidgetto apply interaction to
- sigChanged#
Signal emitted when the interaction configuration has changed
- isZoomOnWheelEnabled()[source]#
Returns whether or not wheel interaction triggers zoom
- Return type:
bool
_utils#
Miscellaneous utility functions for the Plot
- addMarginsToLimits(margins, isXLog, isYLog, xMin, xMax, yMin, yMax, y2Min=None, y2Max=None)[source]#
Returns updated limits by extending them with margins.
- Parameters:
margins (A 4-tuple of floats as (xMinMargin, xMaxMargin, yMinMargin, yMaxMargin)) – The ratio of the margins to add or None for no margins.
- Returns:
The updated limits
- Return type:
tuple of 4 or 6 floats: Either (xMin, xMax, yMin, yMax) or (xMin, xMax, yMin, yMax, y2Min, y2Max) if y2Min and y2Max are provided.
ticklayout#
This module implements labels layout on graph axes.
- numberOfDigits(tickSpacing)[source]#
Returns the number of digits to display for text label.
- Parameters:
tickSpacing (float) – Step between ticks in data space.
- Returns:
Number of digits to show for labels.
- Return type:
int
- niceNumGeneric(value, niceFractions=None, isRound=False)[source]#
A more generic implementation of the _niceNum function
Allows the user to specify the fractions instead of using a hardcoded list of [1, 2, 5, 10.0].
- niceNumbers(vMin, vMax, nTicks=5)[source]#
Returns tick positions.
This function implements graph labels layout using nice numbers by Paul Heckbert from “Graphics Gems”, Academic Press, 1990. See C code.
- Parameters:
vMin (float) – The min value on the axis
vMax (float) – The max value on the axis
nTicks (int) – The number of ticks to position
- Returns:
min, max, increment value of tick positions and number of fractional digit to show
- Return type:
tuple
- ticks(vMin, vMax, nbTicks=5)[source]#
Returns tick positions and labels using nice numbers algorithm.
This enforces ticks to be within [vMin, vMax] range. It returns at least 1 tick (when vMin == vMax).
- Parameters:
vMin (float) – The min value on the axis
vMax (float) – The max value on the axis
nbTicks (int) – The number of ticks to position
- Returns:
tick positions and corresponding text labels
- Return type:
2-tuple: list of float, list of string
- niceNumbersAdaptative(vMin, vMax, axisLength, tickDensity)[source]#
Returns tick positions using
niceNumbers()and a density of ticks.axisLength and tickDensity are based on the same unit (e.g., pixel).
- Parameters:
vMin (float) – The min value on the axis
vMax (float) – The max value on the axis
axisLength (float) – The length of the axis.
tickDensity (float) – The density of ticks along the axis.
- Returns:
min, max, increment value of tick positions and number of fractional digit to show
- Return type:
tuple
- niceNumbersForLog10(minLog, maxLog, nTicks=5)[source]#
Return tick positions for logarithmic scale
- Parameters:
minLog (float) – log10 of the min value on the axis
maxLog (float) – log10 of the max value on the axis
nTicks (int) – The number of ticks to position
- Returns:
log10 of min, max, increment value of tick positions and number of fractional digit to show
- Return type:
tuple of int
- niceNumbersAdaptativeForLog10(vMin, vMax, axisLength, tickDensity)[source]#
Returns tick positions using
niceNumbers()and a density of ticks.axisLength and tickDensity are based on the same unit (e.g., pixel).
- Parameters:
vMin (float) – The min value on the axis
vMax (float) – The max value on the axis
axisLength (float) – The length of the axis.
tickDensity (float) – The density of ticks along the axis.
- Returns:
log10 of min, max, increment value of tick positions and number of fractional digit to show
- Return type:
tuple
- computeLogSubTicks(ticks, lowBound, highBound)[source]#
Return the sub ticks for the log scale for all given ticks if subtick is in [lowBound, highBound]
- Parameters:
ticks – log10 of the ticks
lowBound – the lower boundary of ticks
highBound – the higher boundary of ticks
- Returns:
all the sub ticks contained in ticks (log10)