
Sample Code#
All sample codes can be downloaded as a zip file: silx_examples.zip.
silx.gui sample code#
silx.gui.icons#
Source |
Screenshot |
Description |
|---|---|---|
Display icons and animated icons provided by silx. |
silx.gui.data and silx.gui.hdf5#
Source |
Screenshot |
Description |
|---|---|---|
|
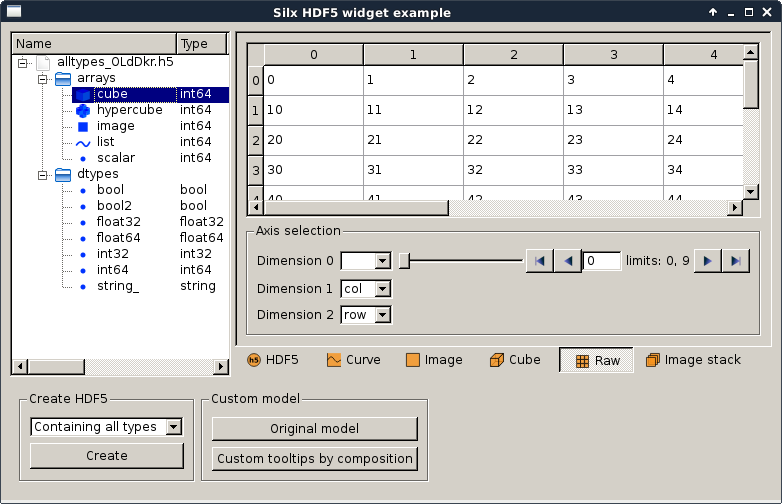
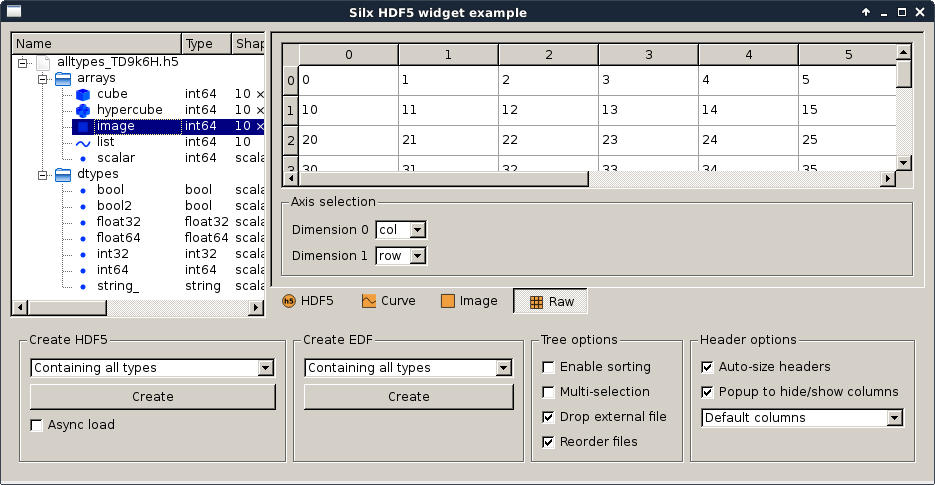
Qt Hdf5 widget examples |
|
|
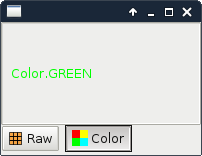
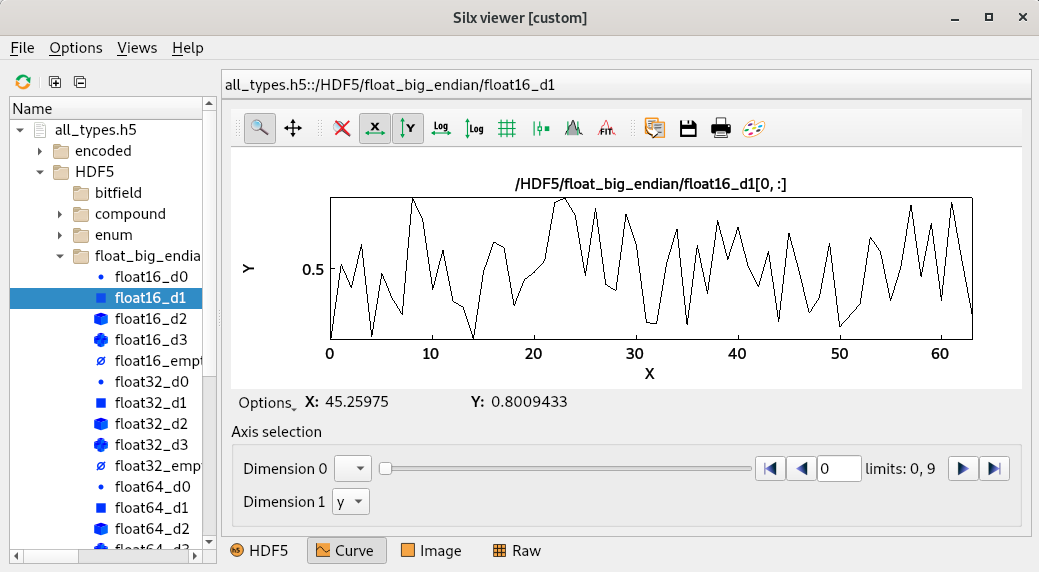
Qt data view example |
|
|
Qt Hdf5 widget examples |
silx.gui.dialog#
Source |
Screenshot |
Description |
|---|---|---|
|
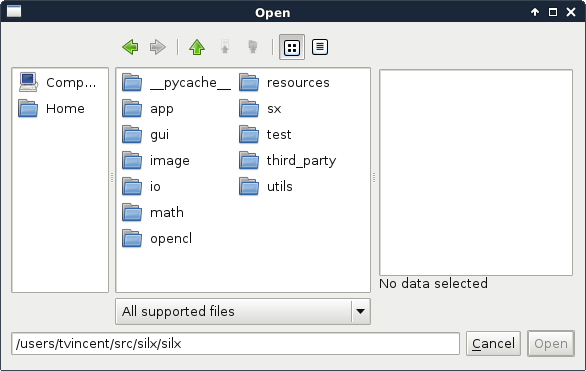
Example for the use of the ImageFileDialog. |
|
|
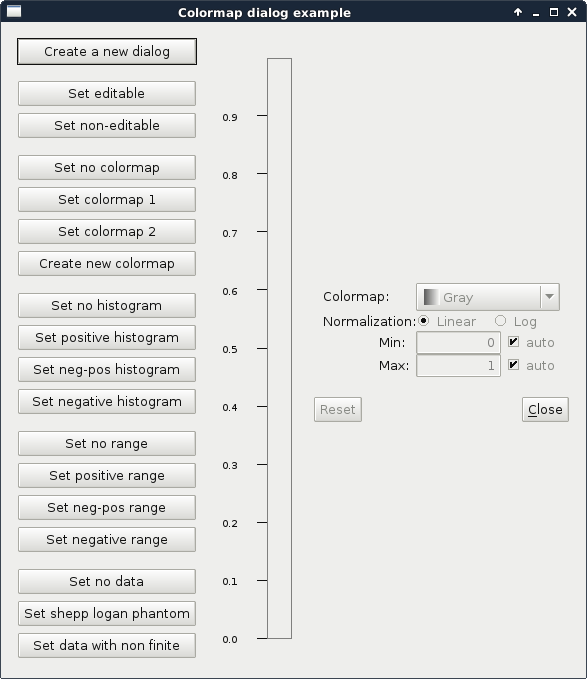
This script shows the features of a |
silx.gui.widgets#
Source |
Screenshot |
Description |
|---|---|---|
|
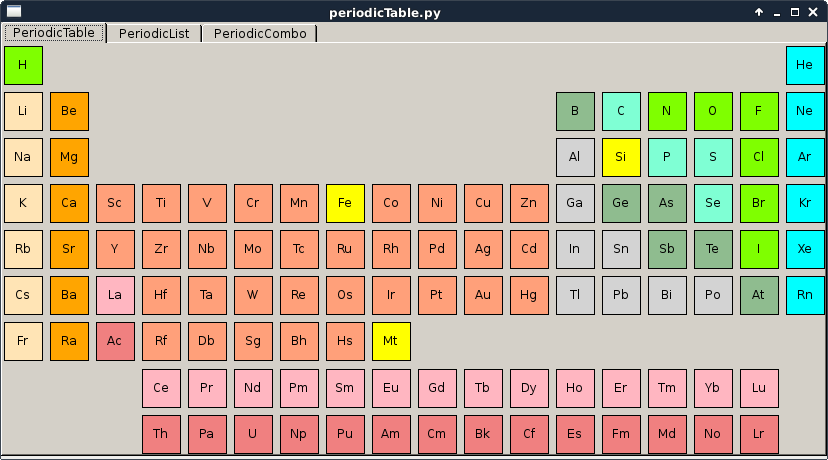
This script is a simple example of how to use the periodic table widgets, select elements and connect signals. |
|
|
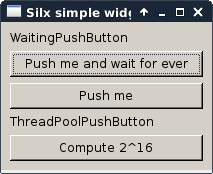
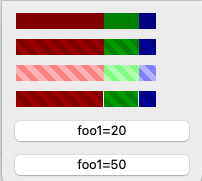
This script shows a gallery of simple widgets provided by silx. It shows the following widgets:
|
|
|
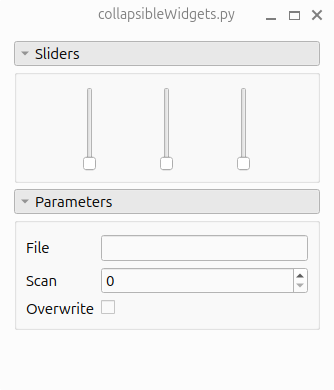
This script shows how to use |
silx.gui.plot sample code#
Widgets#
Source |
Screenshot |
Description |
|---|---|---|
|
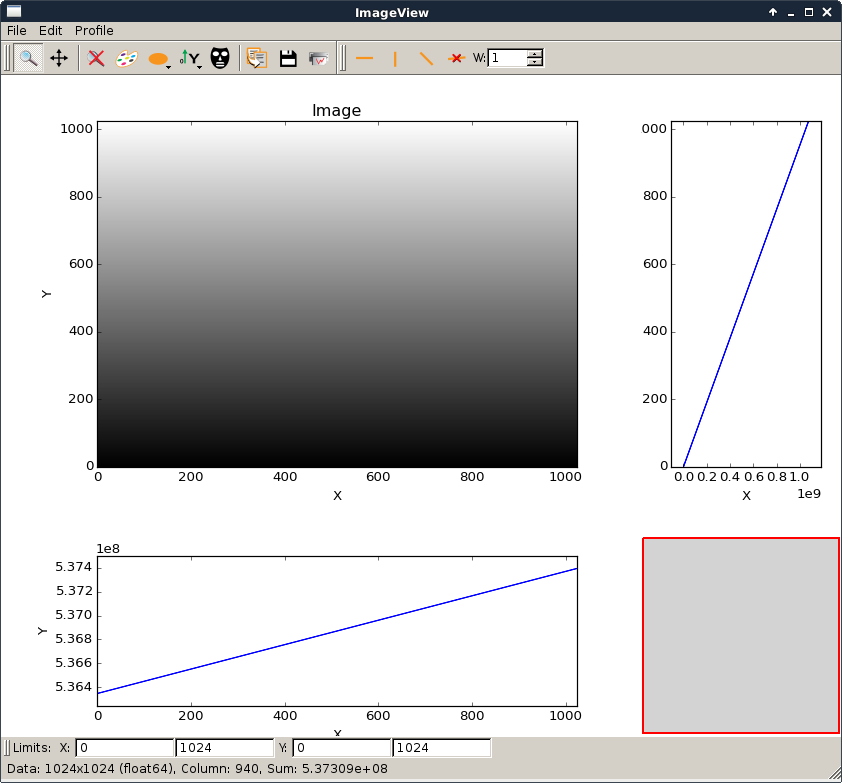
Example to show the use of It can be used to open an EDF or TIFF file from the shell command line. To view an image file with the current installed silx library:
|
|
|
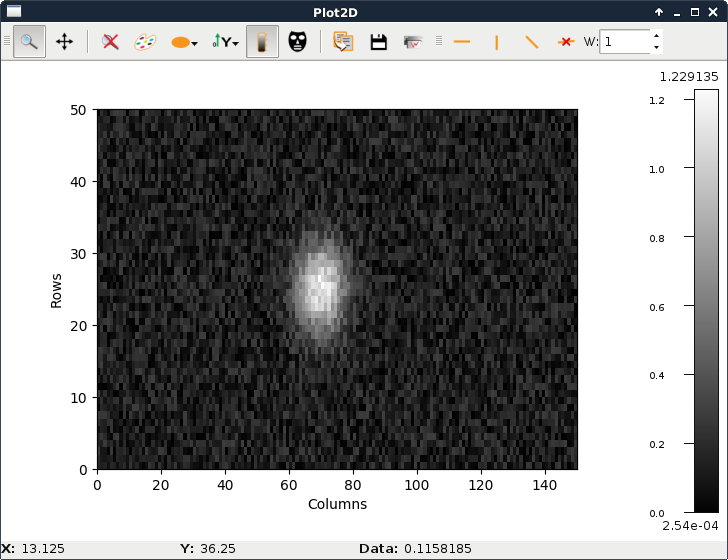
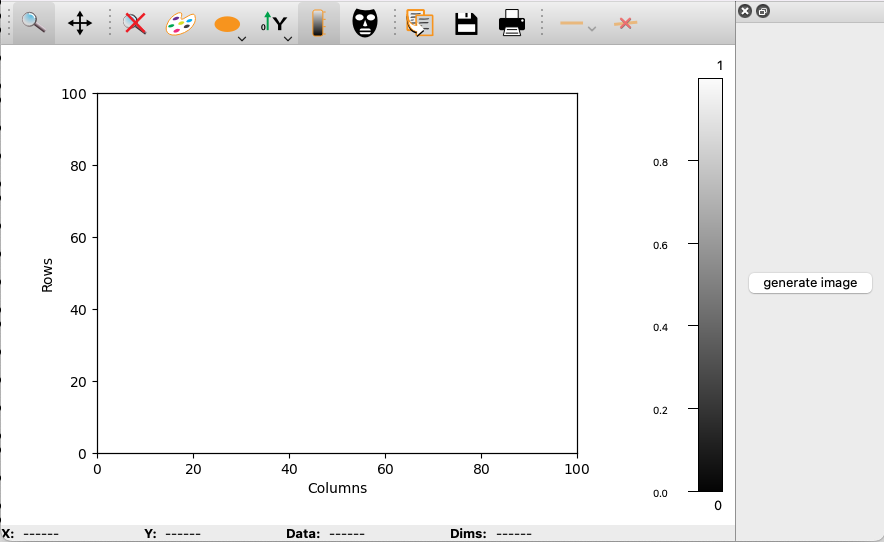
This script is a simple example to illustrate how to use the
|
|
|
Example to show the use of |
|
|
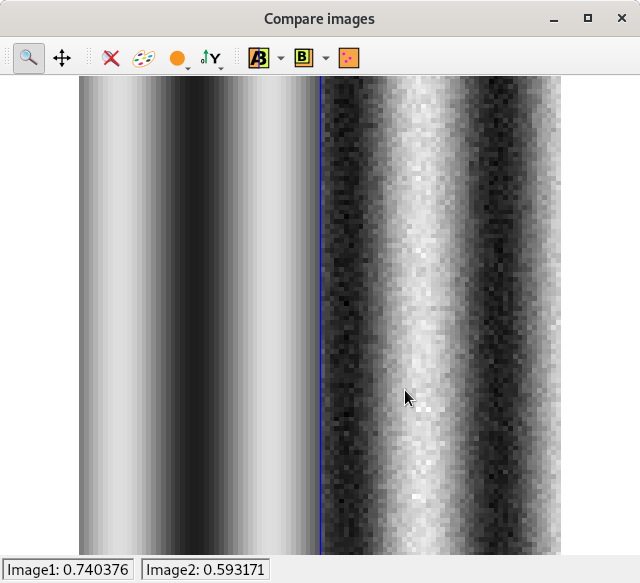
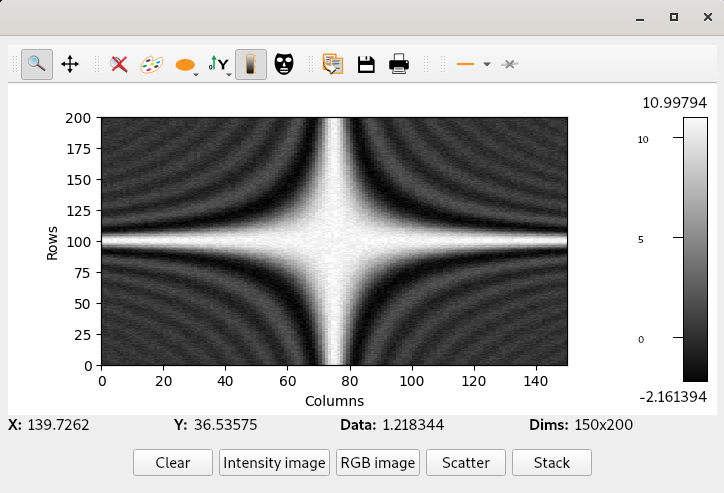
Example demonstrating the use of the widget CompareImages
|
|
|
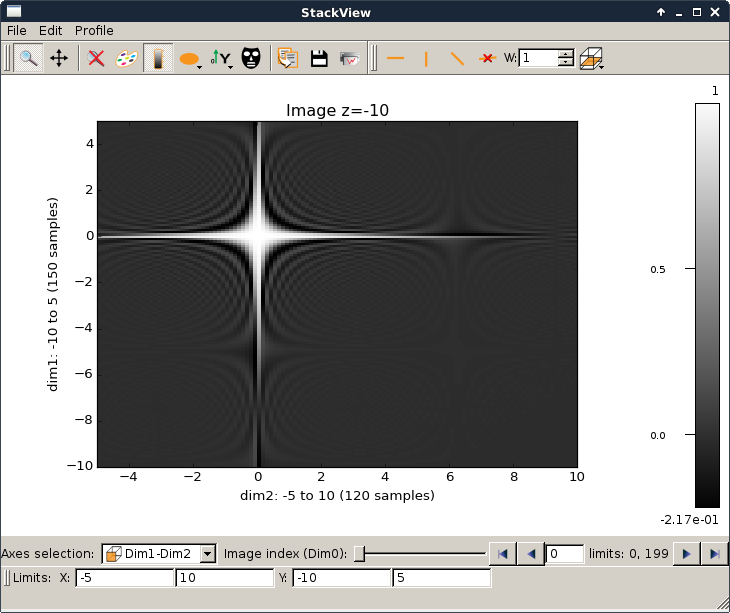
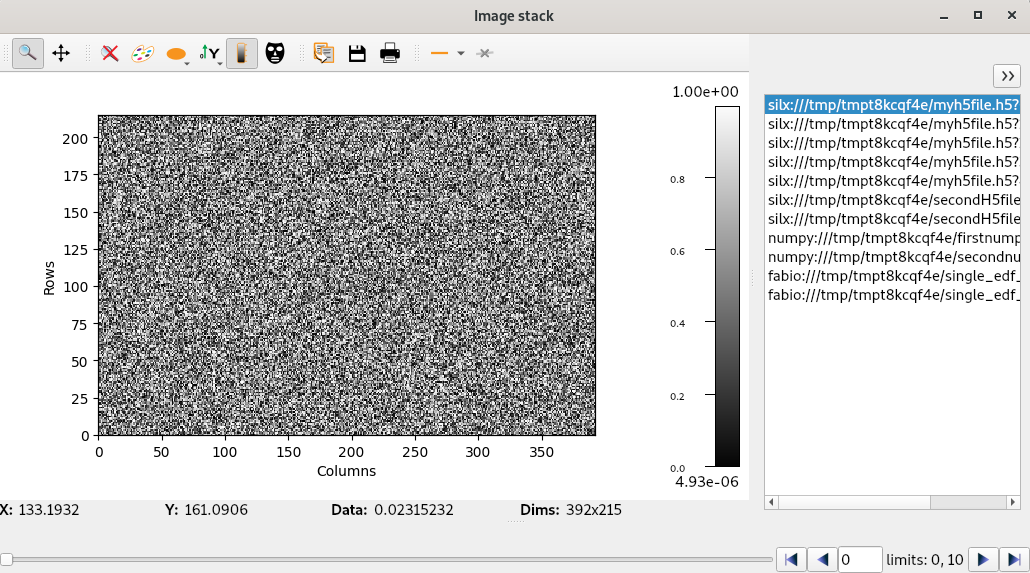
Simple example for using the ImageStack. In this example we want to display images from different source: .h5, .edf and .npy files. To do so we simple reimplement the thread managing the loading of data. |
silx.gui.plot.actions.PlotAction#
Sample code that adds buttons to the toolbar of a silx plot widget.
Source |
Screenshot |
Description |
|---|---|---|
|
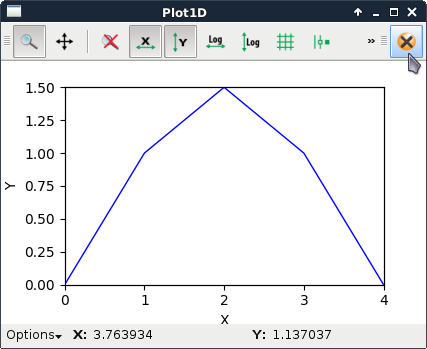
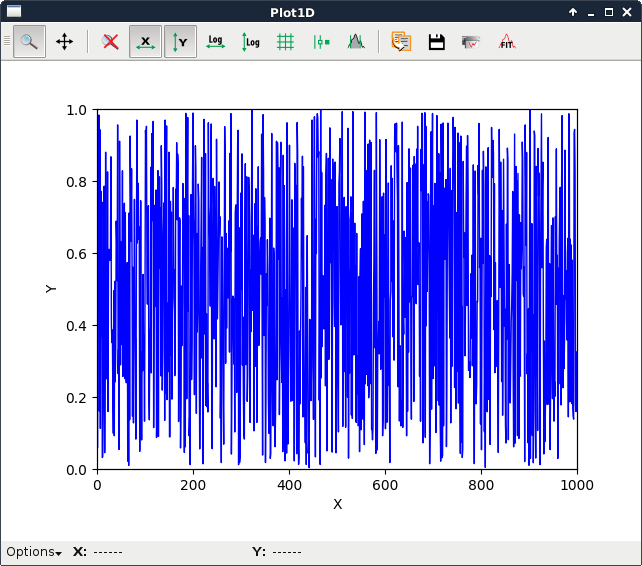
This script shows how to create a minimalistic
This illustrates how to add more buttons in a plot widget toolbar. |
|
|
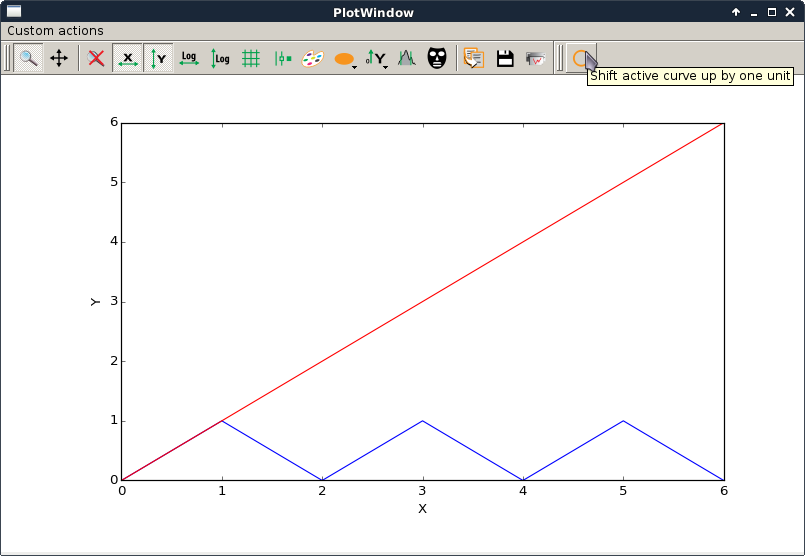
This script is a simple (trivial) example of how to create a The action simply shifts the selected curve up by 1 unit by adding 1 to each value of y. |
|
|
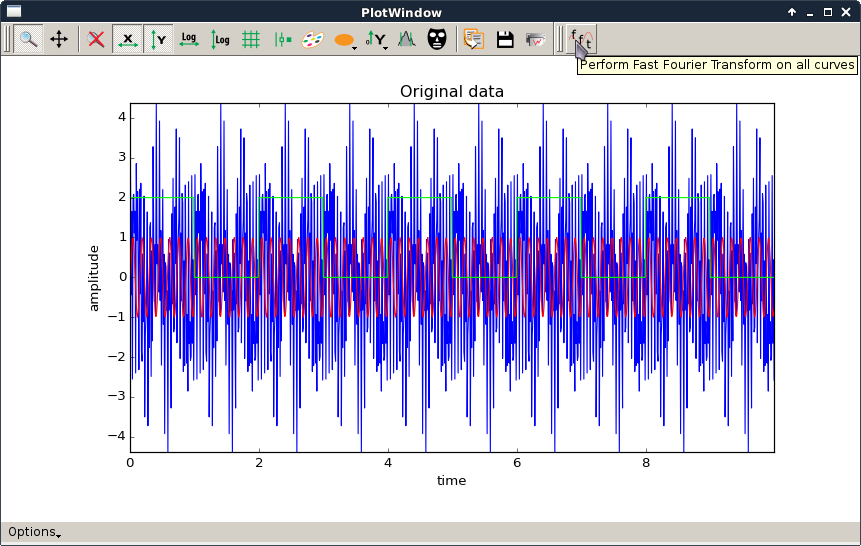
This script is a simple example of how to create a The action computes the FFT of all curves and plots their amplitude spectrum. It also performs the reverse transform.
See shiftPlotAction.py for a simpler example with more basic comments. |
Add features to PlotWidget#
Sample code that adds specific tools or functions to PlotWidget.
Source |
Screenshot |
Description |
|---|---|---|
|
This script shows how to create a custom window around a PlotWidget. It subclasses
|
|
|
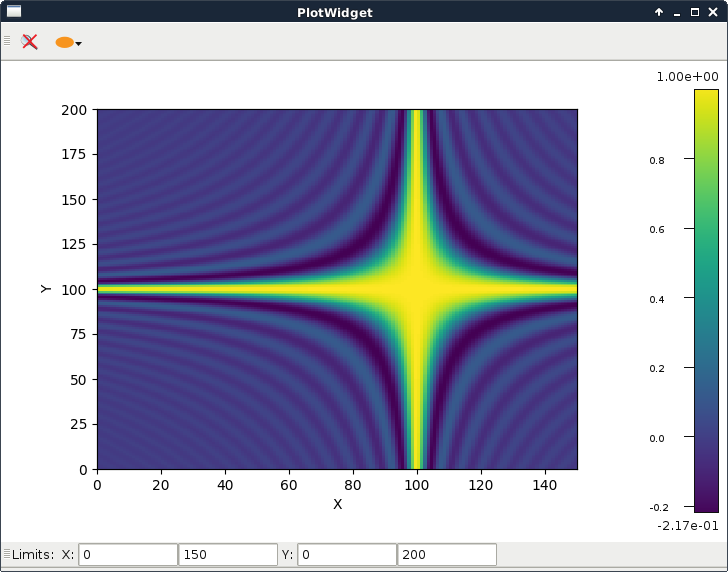
This example illustrates how to use a |
|
|
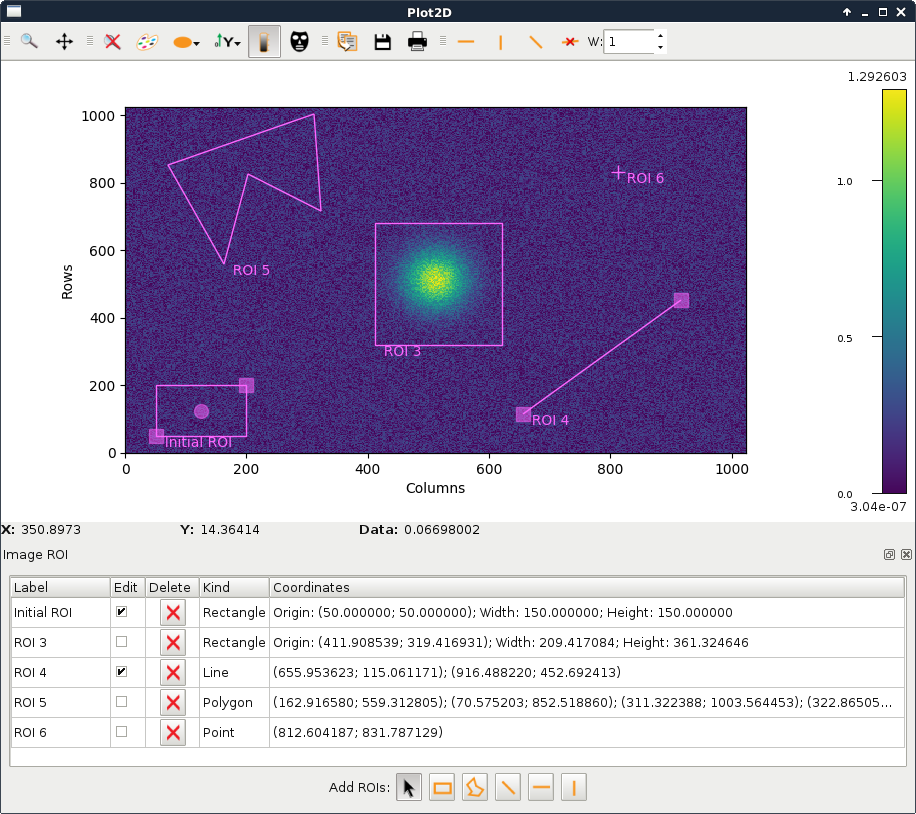
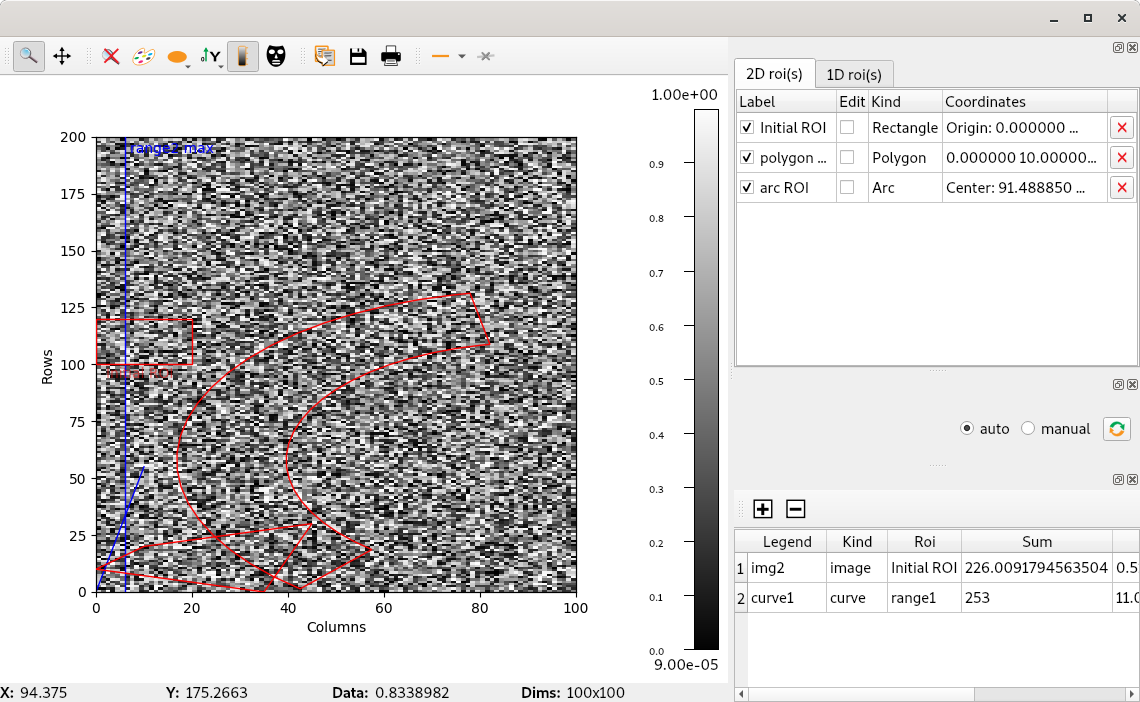
This script illustrates image ROI selection in a It uses |
|
|
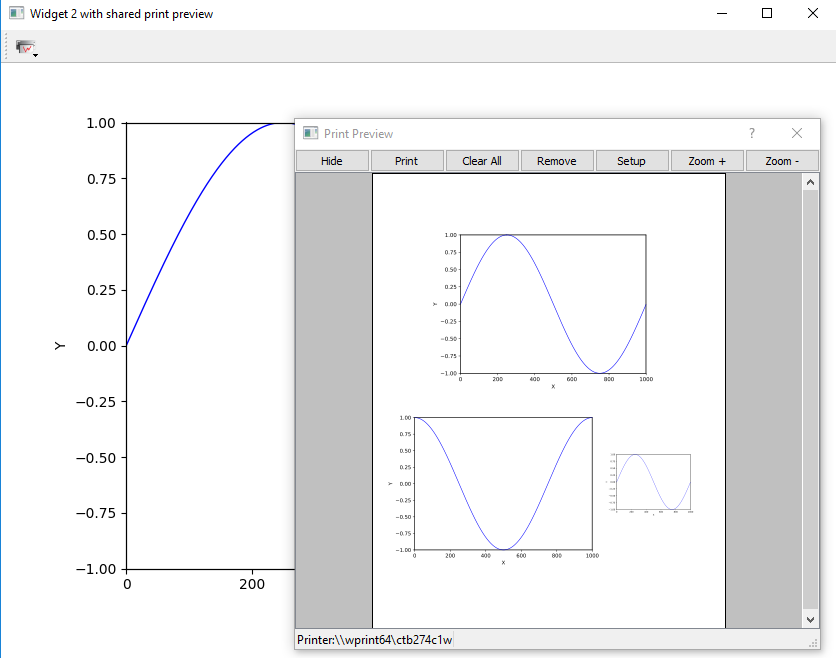
This script illustrates how to add a print preview tool button to any plot
widget inheriting Three plot widgets are instantiated. One of them uses a standalone
|
|
|
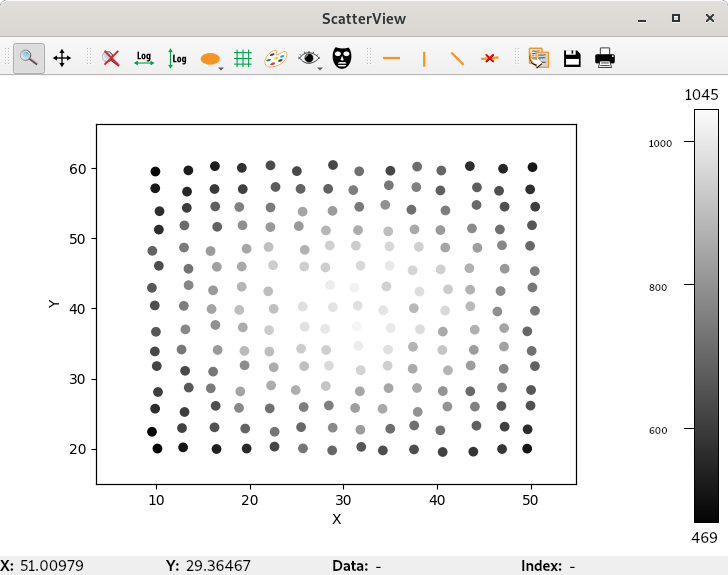
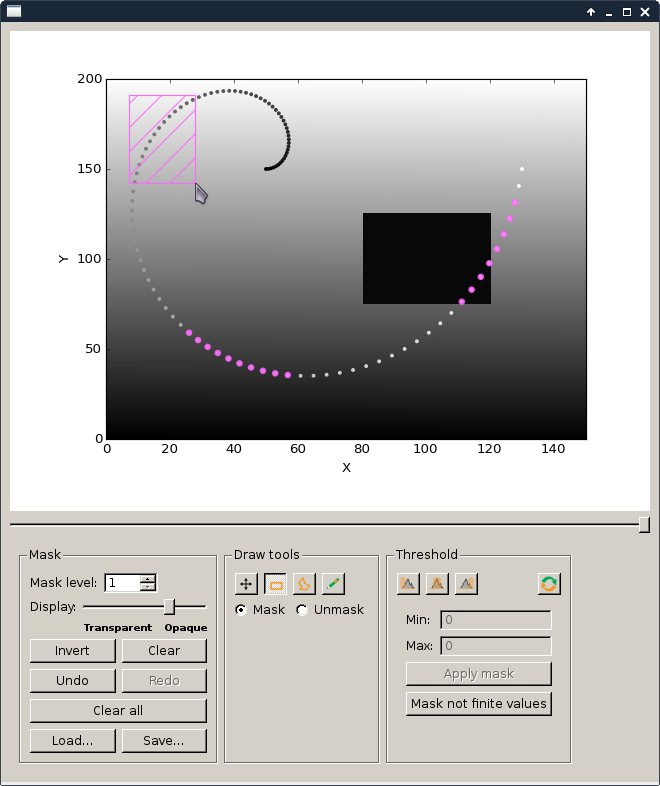
This example demonstrates how to use ScatterMaskToolsWidget and NamedScatterAlphaSlider with a PlotWidget. |
|
|
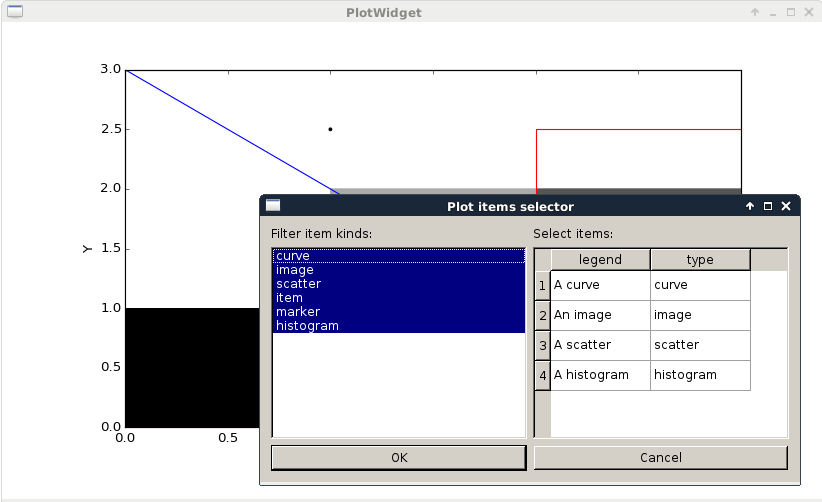
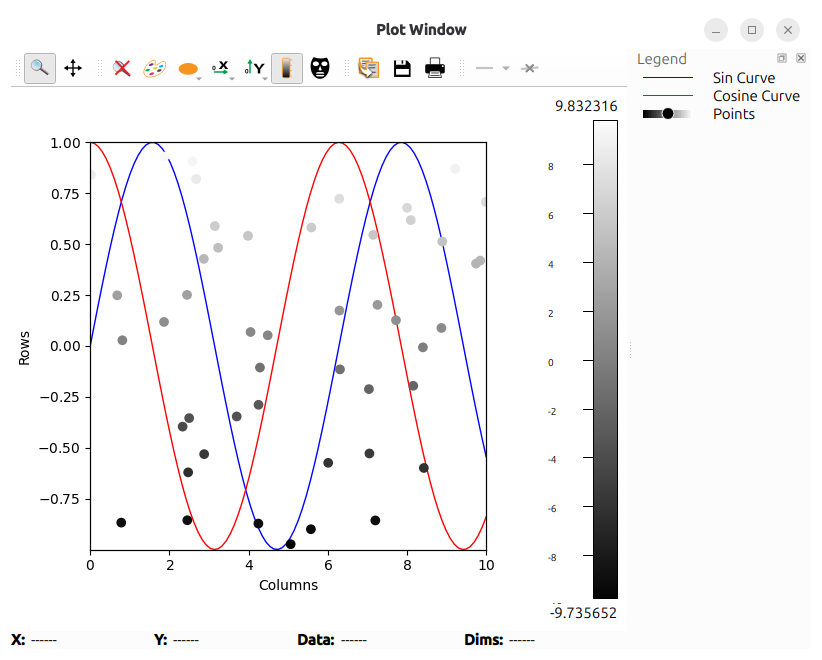
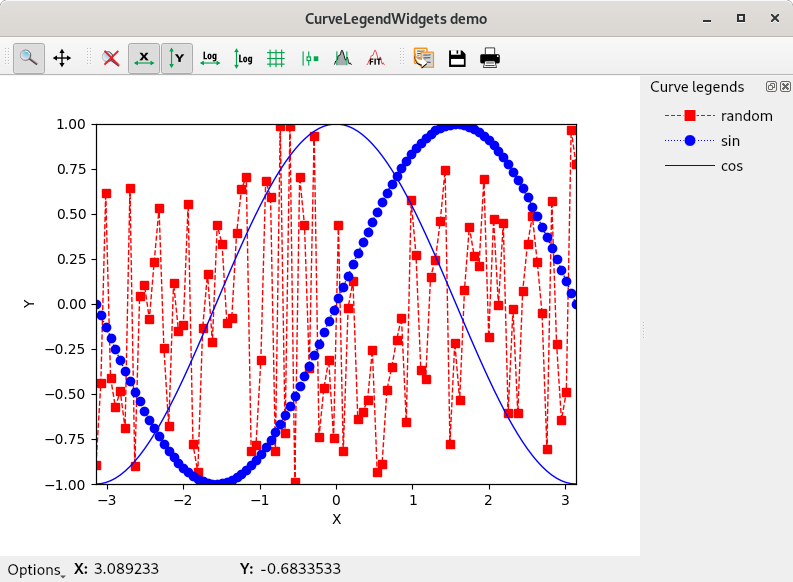
This example illustrates how to display legends of items in a PlotWidget. It uses a |
|
|
This example illustrates the use of
|
|
|
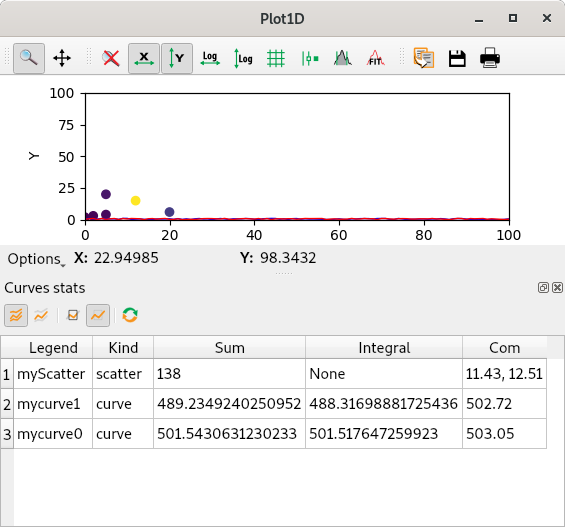
This script is a simple example of how to add your own statistic to a
On this example we will:
Note for now the possible types manged by the Stats are (‘curve’, ‘image’, ‘scatter’ and ‘histogram’) |
|
|
This script is a simple example of how to display statistics on a specific region of interest. An example on how to define your own statistic is given in the ‘plotStats.py’ script. |
|
|
Example illustrating the different profile tools. |
PlotWidget features#
Sample code that illustrates some functionalities of PlotWidget.
Source |
Screenshot |
Description |
|---|---|---|
|
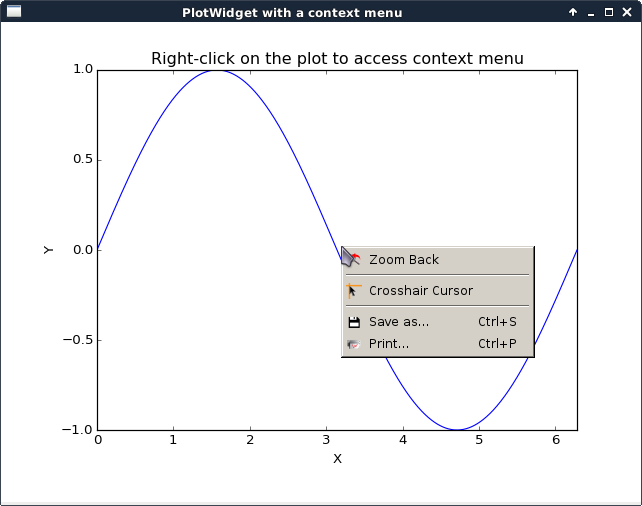
This script illustrates the addition of a context menu to a
This is done by adding a custom context menu to the plot area of PlotWidget: - set the context menu policy of the plot area to Qt.CustomContextMenu. - connect to the plot area customContextMenuRequested signal. The same method works with For more information on context menus, see Qt documentation. |
|
|
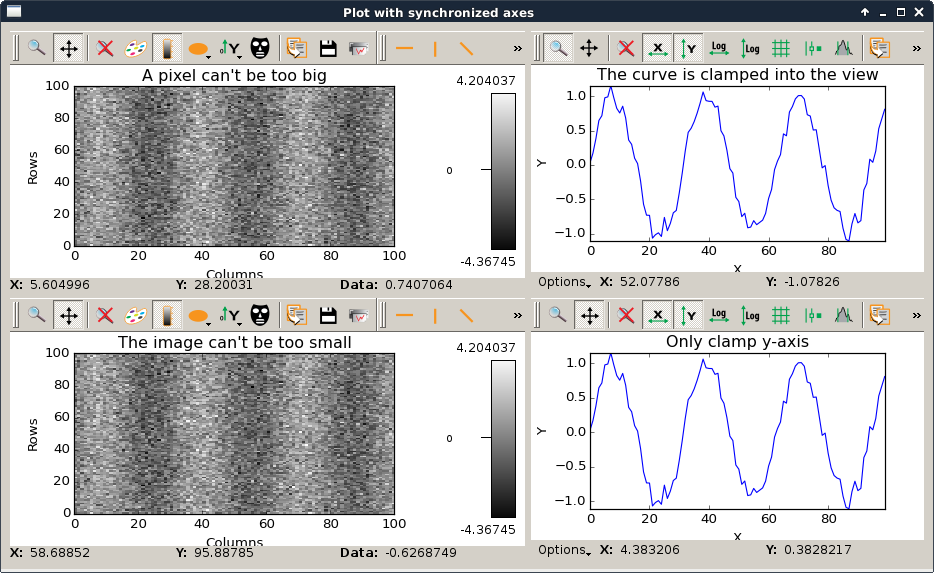
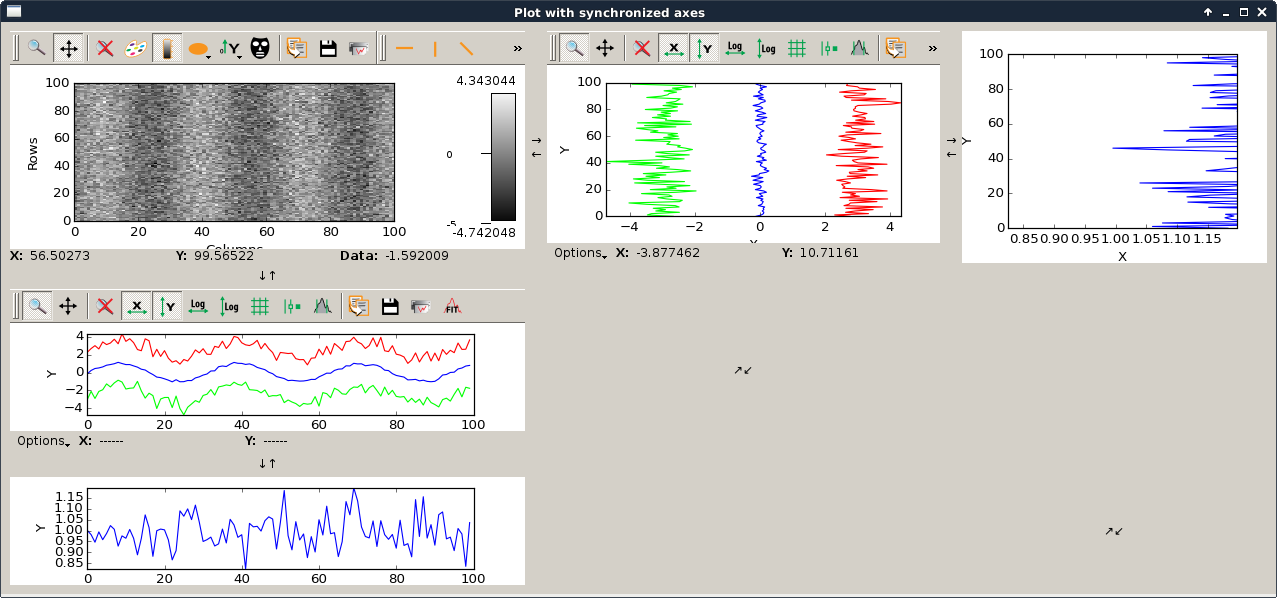
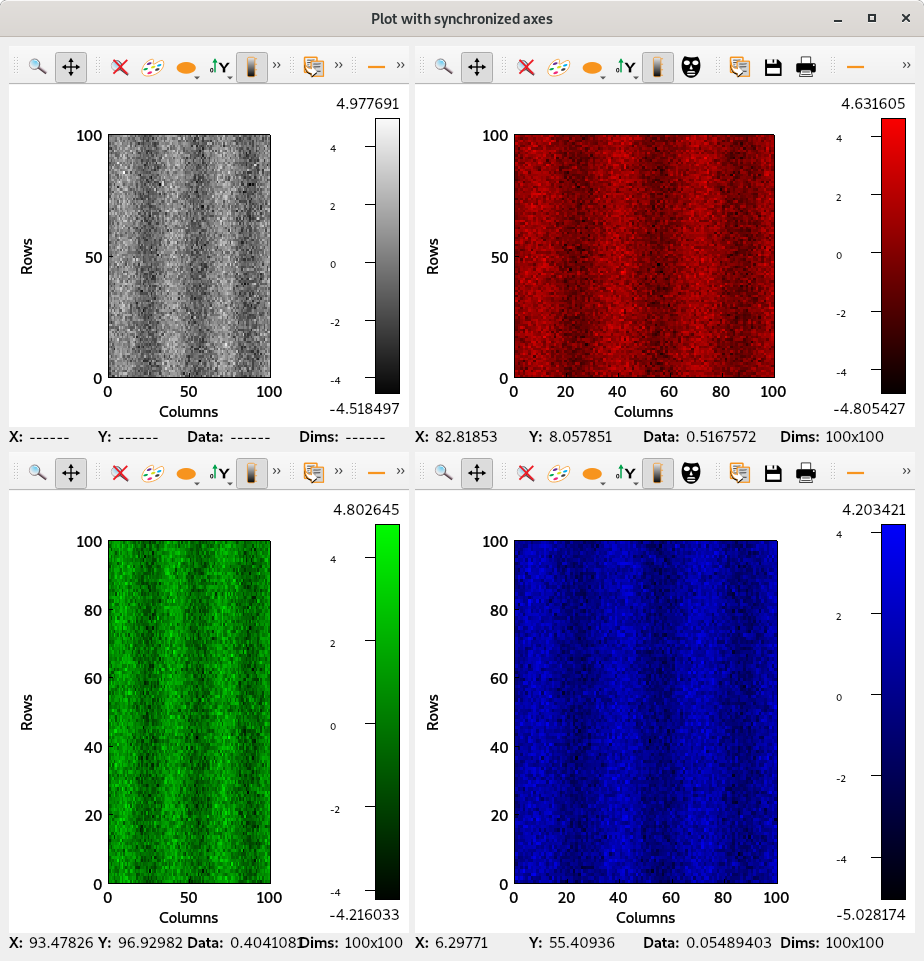
This script is an example to illustrate how to use axis synchronization tool. |
|
|
This script illustrates the update of a The problem is that plot and GUI methods should be called from the main thread.
To safely update the plot from another thread, one need to execute the update
asynchronously in the main thread.
In this example, this is achieved with
In this example a thread calls submitToQtMainThread to update the curve of a plot. |
|

|
This script illustrates the update of a |
|
|
This script illustrates the update of a The problem is that plot and GUI methods should be called from the main thread.
To safely update the plot from another thread, one need to execute the update
asynchronously in the main thread.
In this example, this is achieved with
In this example a thread calls submitToQtMainThread to update the curve of a plot. |
|
|
This script is an example to illustrate how to use axis synchronization tool. |
|
|
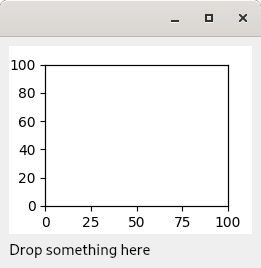
Example of drop zone supporting application/x-silx-uri. This example illustrates the support of drag&drop of silx URLs.
It provides 2 URLs (corresponding to 2 datasets) that can be dragged to
either a |
|
|
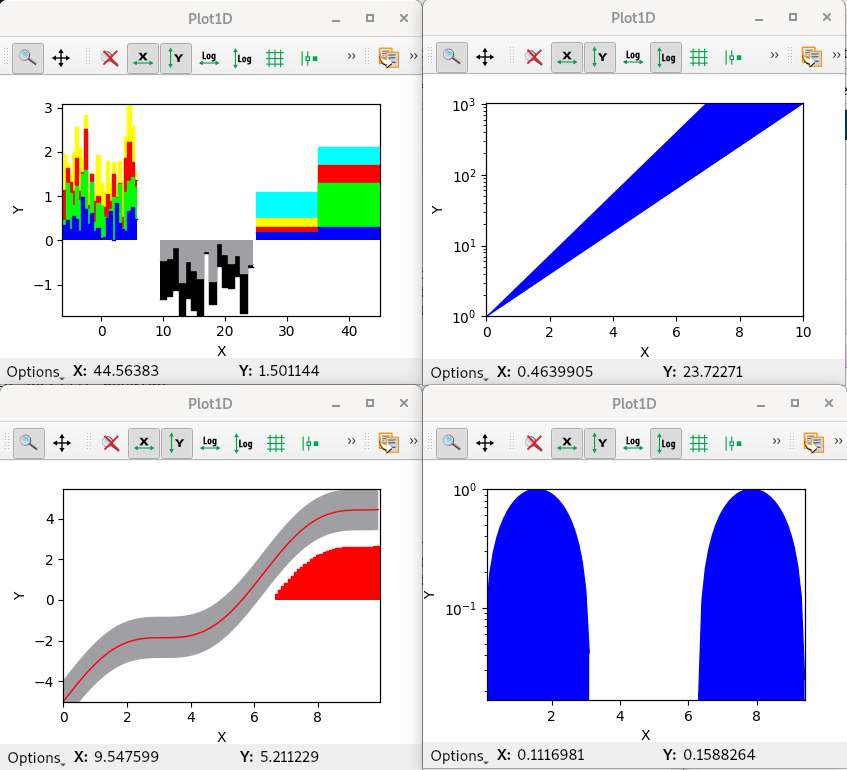
This example illustrates some usage possible with the baseline parameter |
|
|
This script is an example to illustrate how to use axis synchronization tool. |
|
|
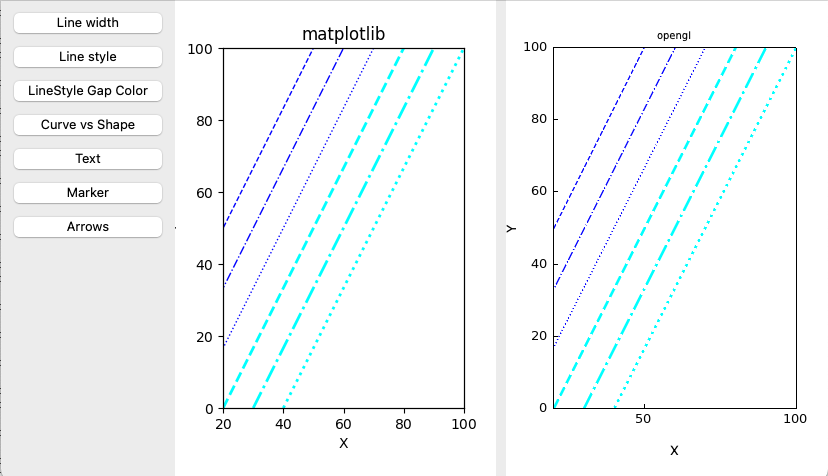
This script compares the rendering of PlotWidget’s matplotlib and OpenGL backends. |
silx.gui.plot3d sample code#
Source |
Screenshot |
Description |
|---|---|---|
|
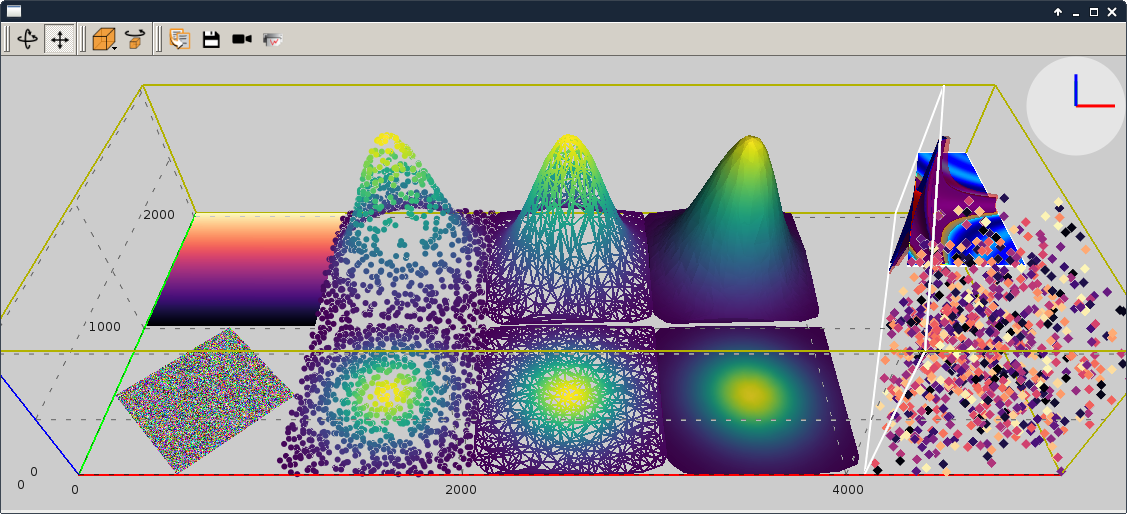
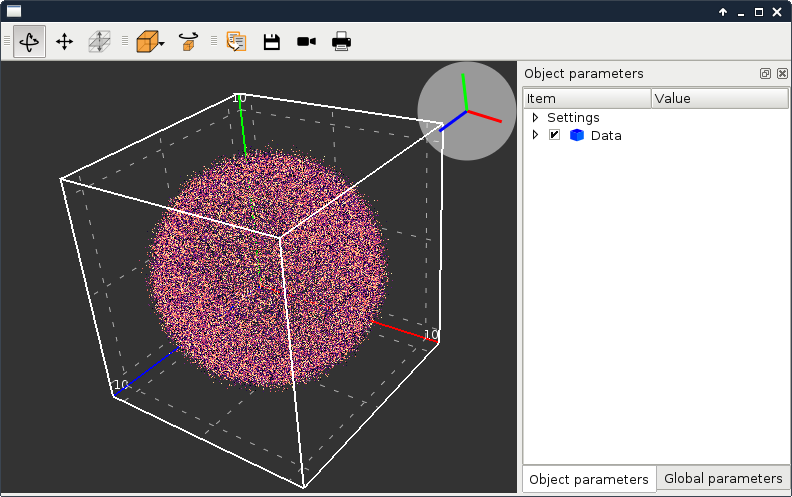
This script displays the different items of It shows the different visualizations of It features:
|
|
|
This script illustrates the update of a
The problem is that GUI methods should be called from the main thread.
To safely update the scene from another thread, one need to execute the update
asynchronously in the main thread.
In this example, this is achieved with
In this example a thread calls submitToQtMainThread to append data to a 3D scatter. |
|
|
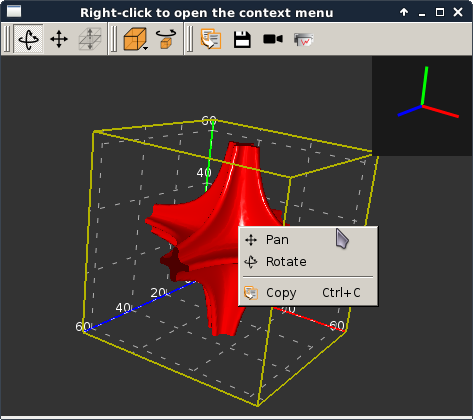
This script adds a context menu to a This is done by adding a custom context menu to the
For more information on context menus, see Qt documentation. |
|
|
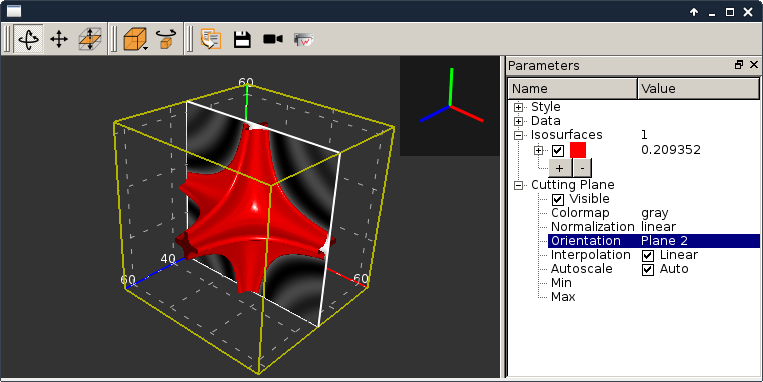
This script illustrates the use of It loads a 3D scalar data set from a file and displays iso-surfaces and an interactive cutting plane. It can also be started without providing a file. |
silx.gui.widgets sample code#
Source |
Screenshot |
Description |
|---|---|---|
|
This script illustrates the use of |
|
|
This script illustrates the use of |
|
|
Demonstration window that displays a wait icon until the plot is updated. |
silx.io sample code#
Source |
Screenshot |
Description |
|---|---|---|
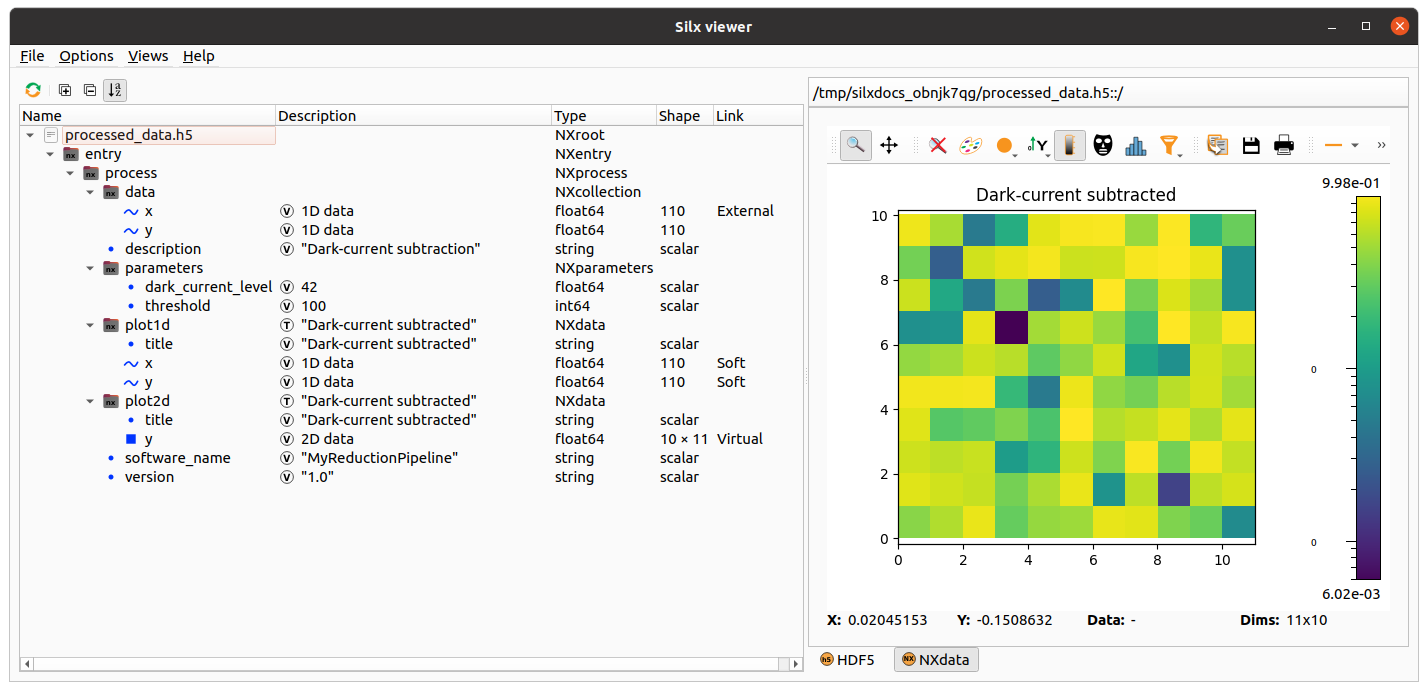
This script is an example of how to use the |
||
|
Create HDF5 content from a schema. |
|
|
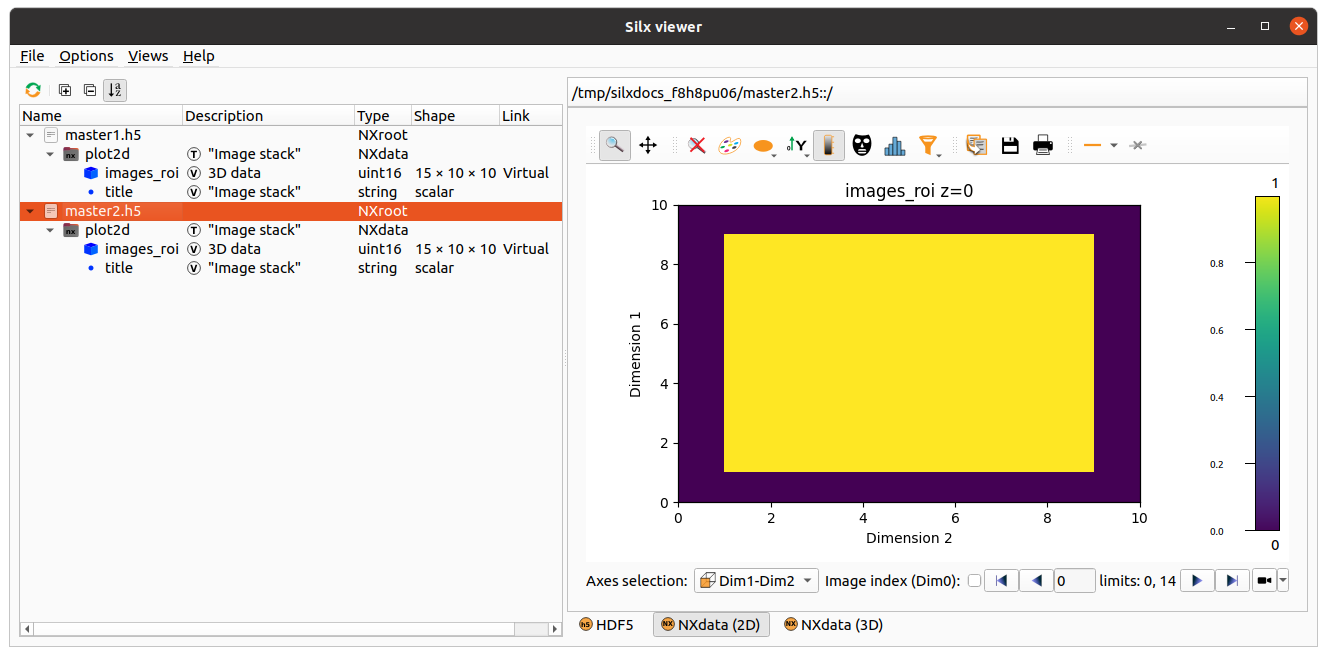
Create HDF5 content from a schema: simple HDF5 image stack. |
|
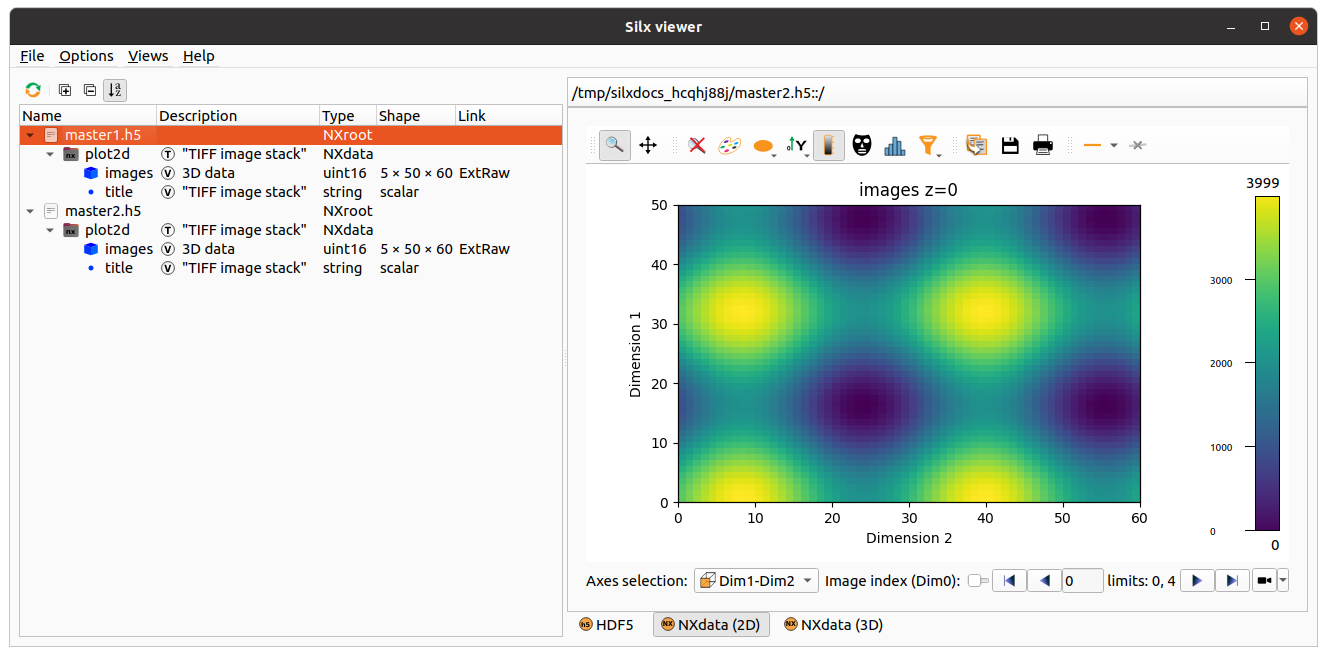
|
Create HDF5 content from a schema: simple TIFF image stack. |
silx.image sample code#
Source |
Screenshot |
Description |
|---|---|---|
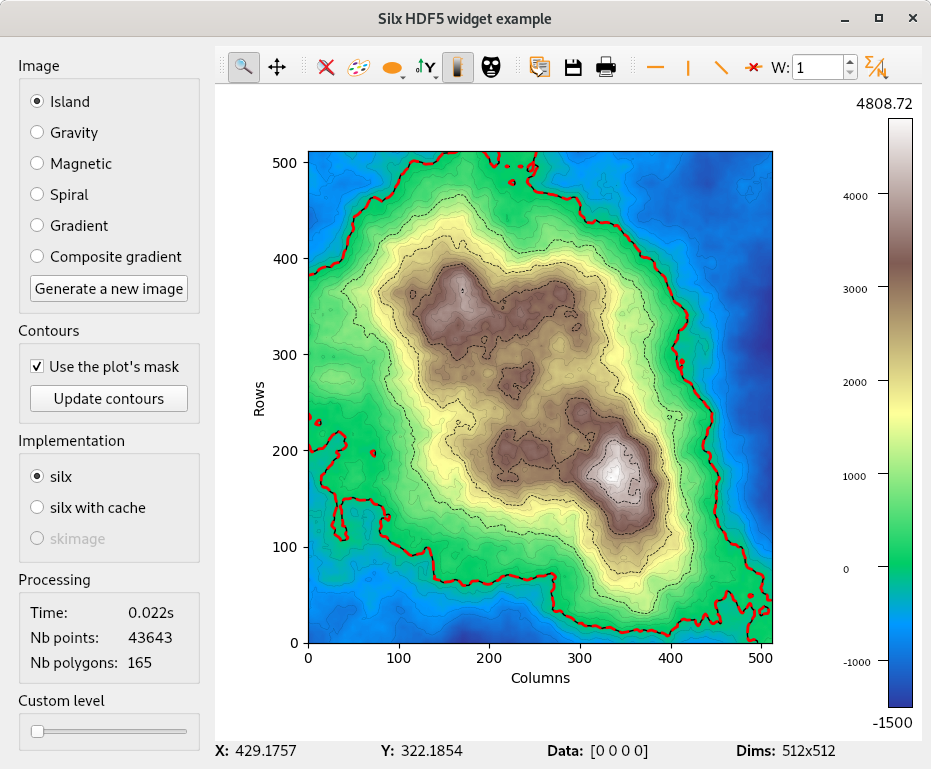
|
Find contours examples Note This module has an optional dependency with sci-kit image library. You might need to install it if you don’t already have it. |
silx.app sample code#
Source |
Screenshot |
Description |
|---|---|---|
|
Sample code illustrating how to custom silx view into another application. |