Widgets gallery
silx.gui.console Widgets
| Widget | Description |
|---|---|
|
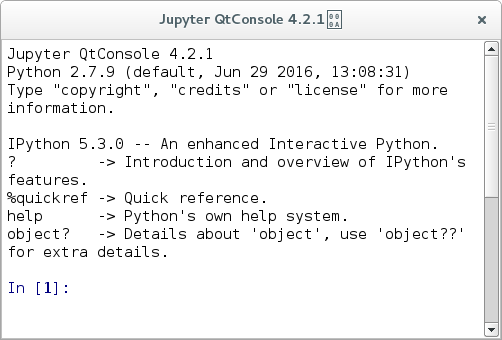
IPythonWidget is an interactive console widget running a
:class`QtInProcessKernelManager`. This allows to push variables to the
interactive console, and interact with your application (e.g. adding
curves to a plot) |
|
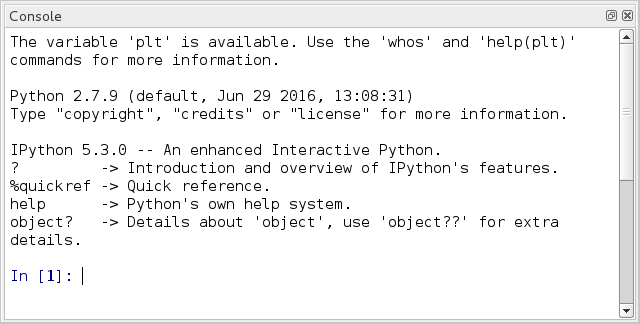
IPythonDockWidget is an IPythonWidget embedded in
a QDockWidget. |
silx.gui.data Widgets
| Widget | Description |
|---|---|
|
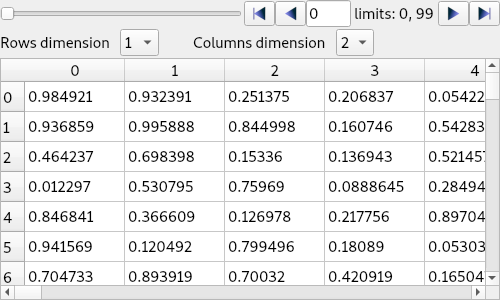
ArrayTableWidget is a table widget with browsers designed to
display the content of multi-dimensional data arrays. |
|
DataViewer is a widget designed to display data using the most
adapted view. |
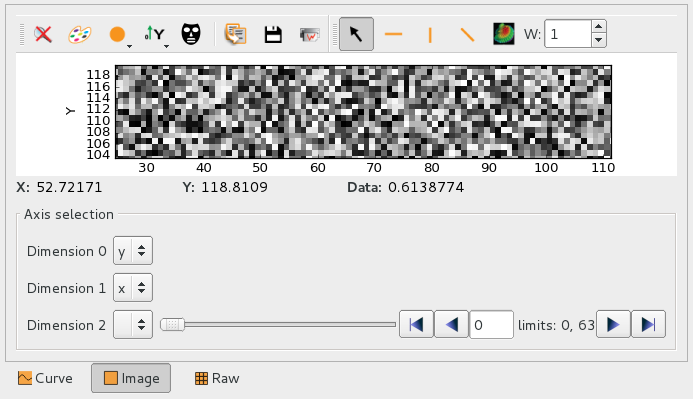
|
DataViewerFrame is a DataViewer with a view selector
that lets you view the data using any compatible view. |
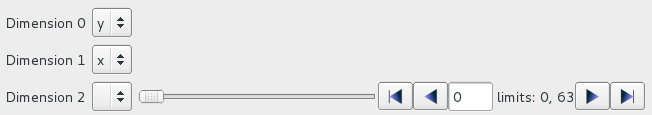
|
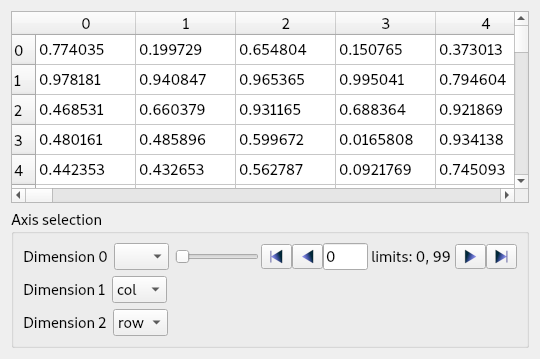
NumpyAxesSelector is a widget designed to select a subarray in a
n-dimensional array, by fixing the index on some of the dimensions. |
silx.gui.dialog Widgets
| Widget | Description |
|---|---|
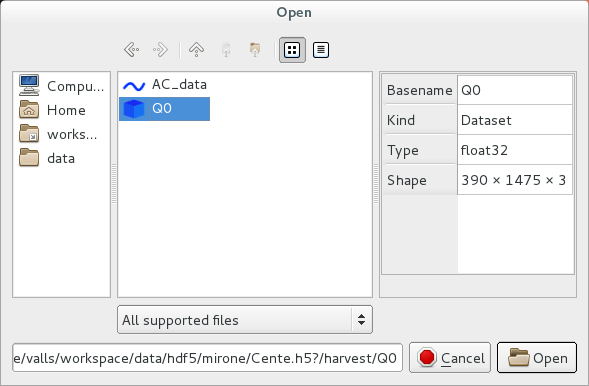
|
DataFileDialog is a dialog that allows users to select
any datasets or groups from any HDF5-like file. It features a file
browser that can also browse the content of HDF5 file as if they were
directories. |
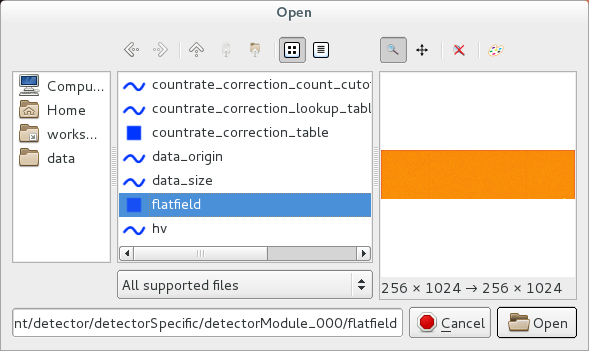
|
ImageFileDialog is a dialog that allows users to select
an image from any HDF5-like file. |
|
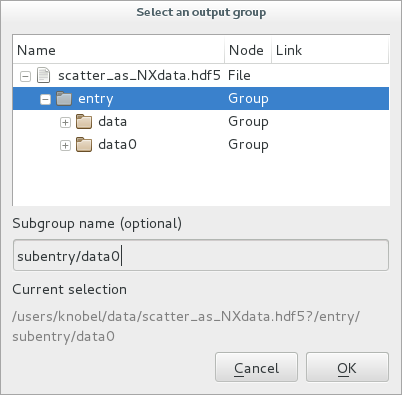
GroupDialog is a dialog that allows users to select
a group from one or several specified HDF5-like files. |
silx.gui.fit Widgets
| Widget | Description |
|---|---|
|
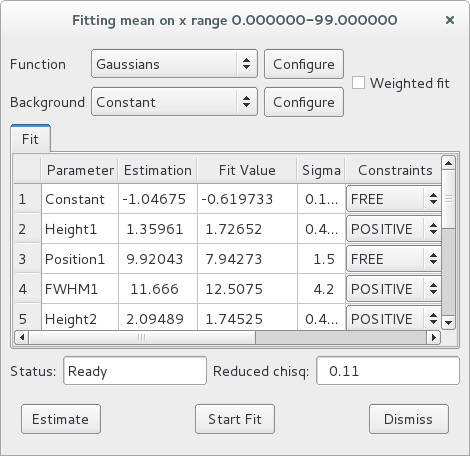
FitWidget is a widget designed to configure and run a fitting process,
with constraints on parameters. |
|
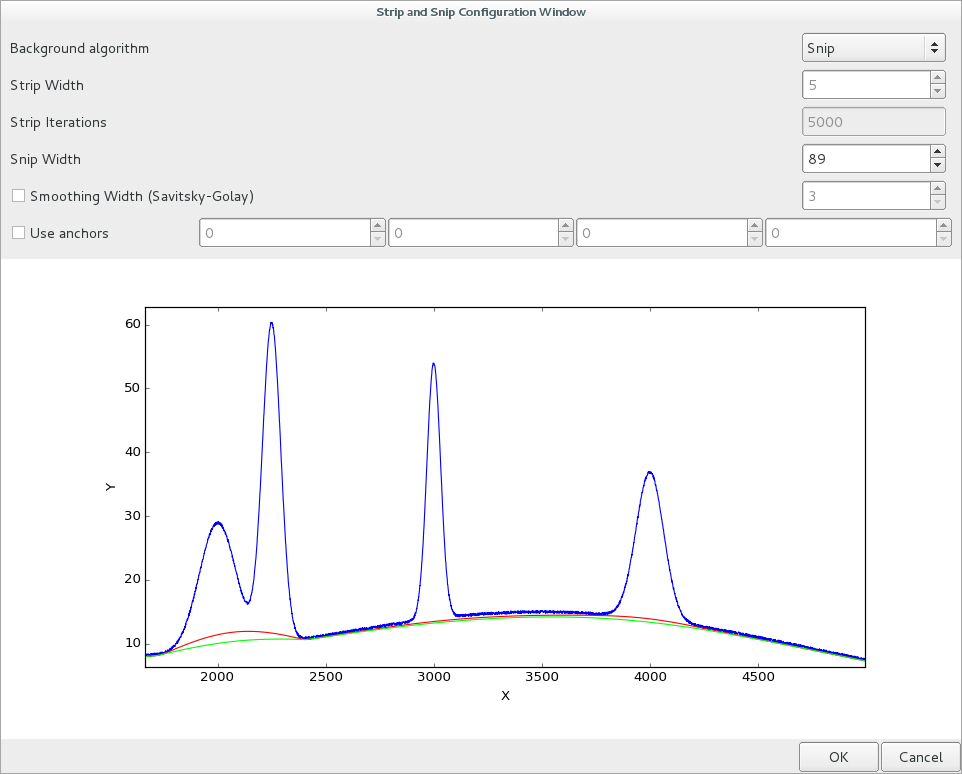
BackgroundWidget.BackgroundDialog is a widget designed to adjust
the parameters and preview the results of a snip or strip background
filter. |
silx.gui.hdf5 Widgets
| Widget | Description |
|---|---|
|
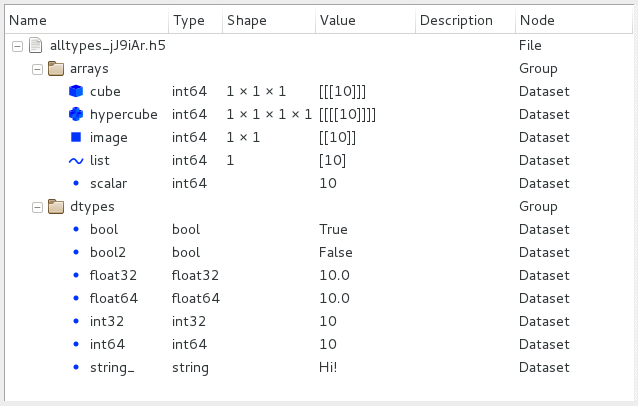
Hdf5TreeView is a tree view desiged to browse an HDF5
file structure. |
silx.gui.plot Widgets
Plotting widgets:
| Widget | Description |
|---|---|
|
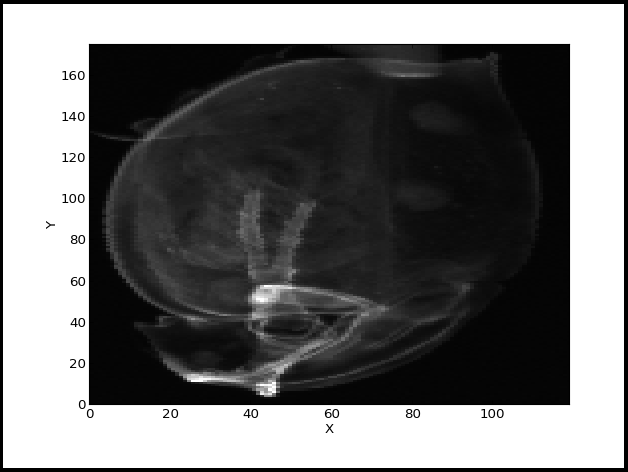
PlotWidget is the base Qt widget providing a plot area.
Other plot widgets are based on this one and provides the same API. |
|
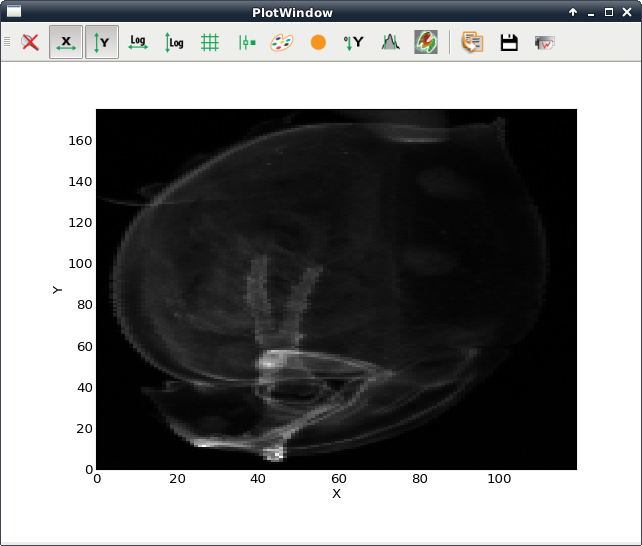
PlotWindow adds a toolbar to PlotWidget.
The content of this toolbar can be configured from the
PlotWindow constructor or by hiding its content afterward. |
|
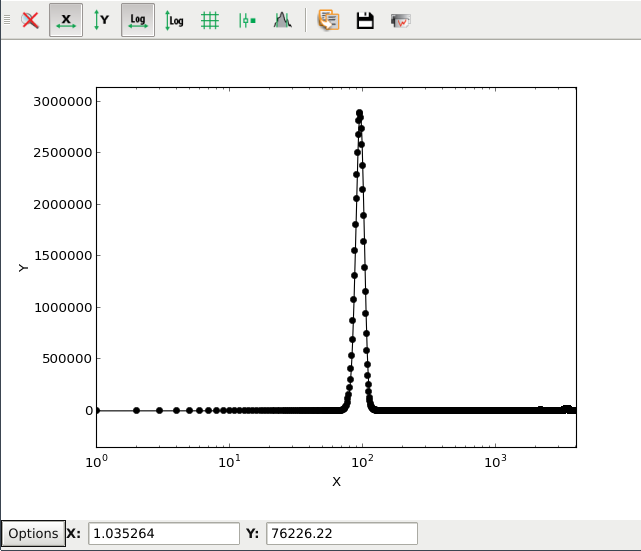
Plot1D is a PlotWindow configured with tools useful
for curves. |
|
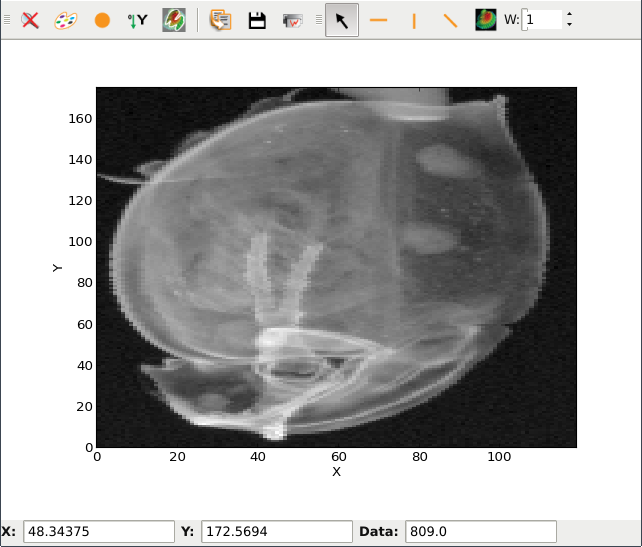
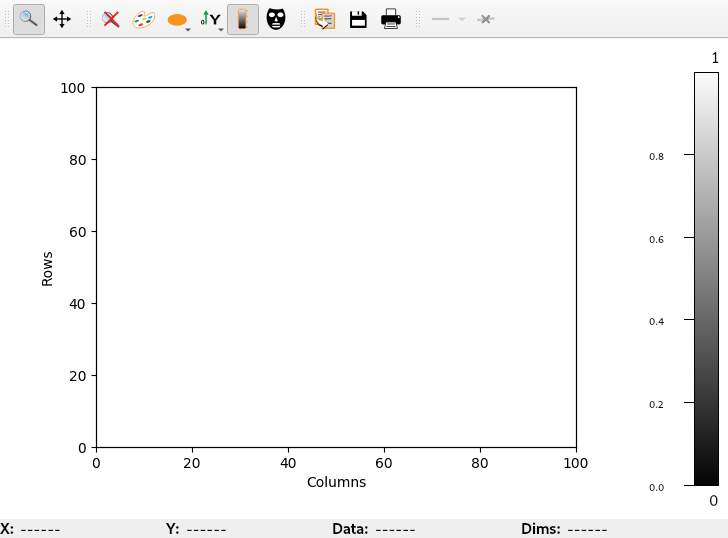
Plot2D is a PlotWindow configured with tools useful
for images. |
|
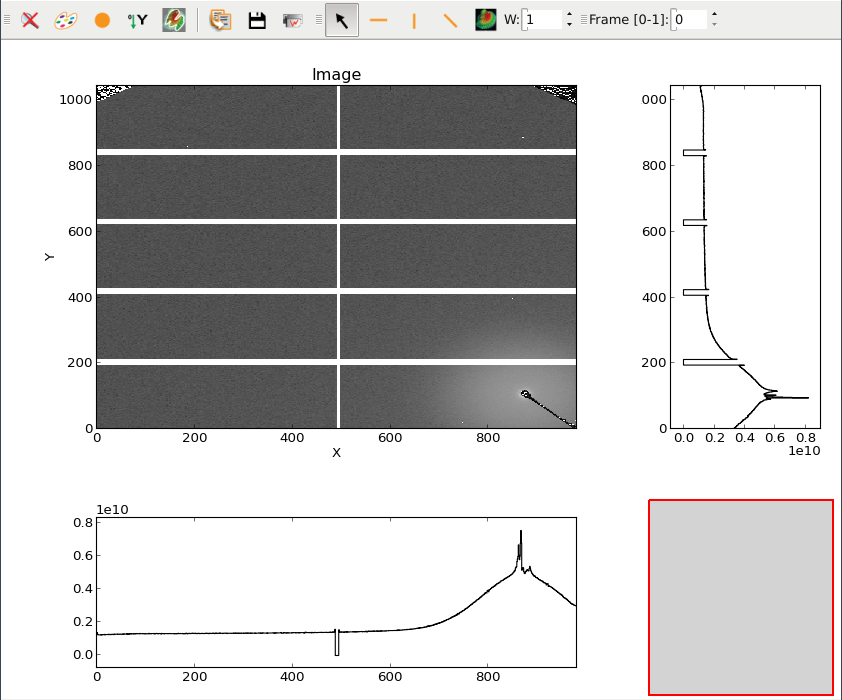
ImageView adds side histograms to a Plot2D widget. |
|
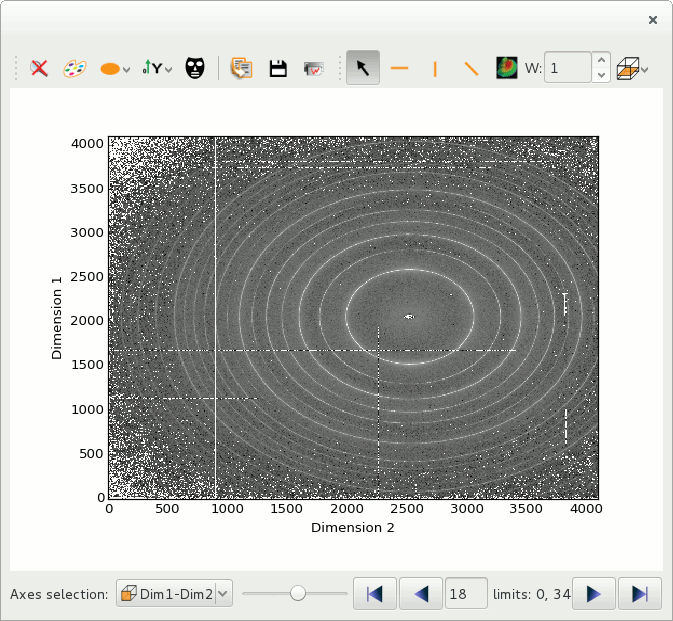
StackView is a widget designed to display an image from a
stack of images in a PlotWindow widget, with a frame browser
to navigate in the stack. The profile tool can do a 2D profile on the
stack of images. |
|
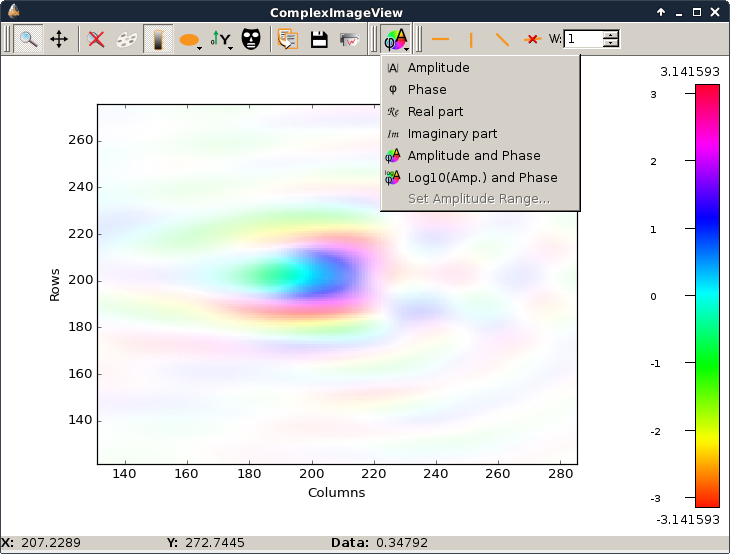
ComplexImageView is a widget dedicated to visualize a single
2D dataset of complex data.
It allows to switch between viewing amplitude, phase, real, imaginary,
colored phase with amplitude or log10(amplitude) as brightness. |
|
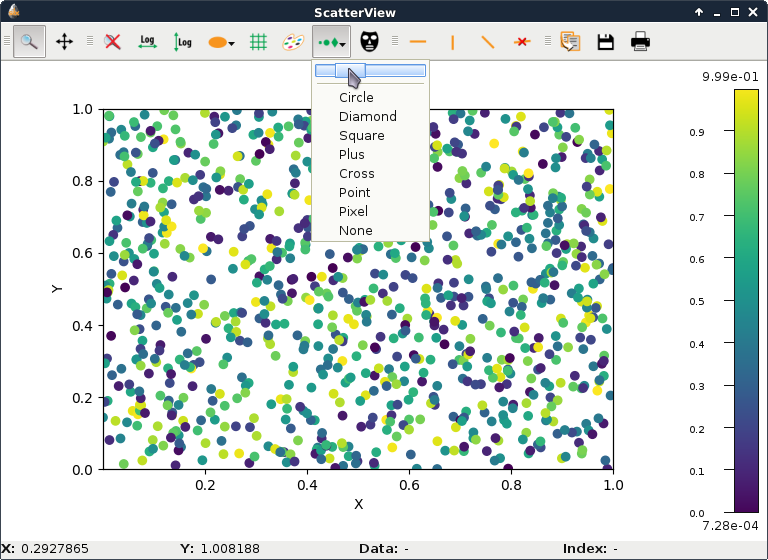
ScatterView is a widget dedicated to visualize a scatter plot. |
|
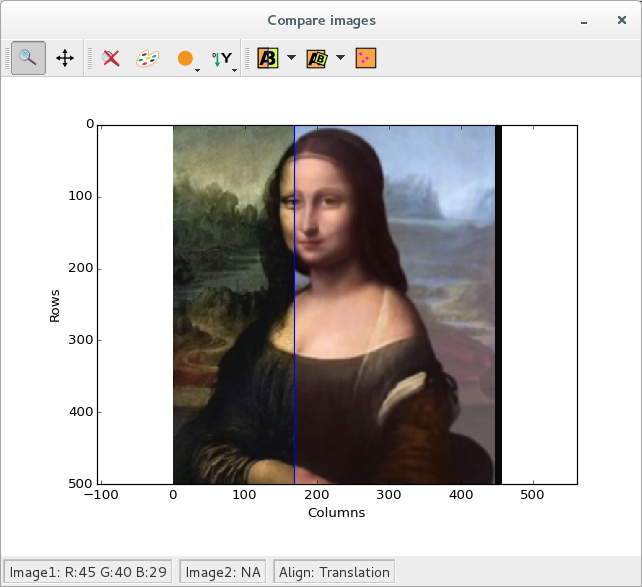
CompareImages is a widget dedicated to compare 2 images. |
Additional widgets:
| Widget | Description |
|---|---|

|
PlotTools.PositionInfo is a widget displaying mouse position and
information of a PlotWidget associated to the mouse position. |
|
PlotTools.LimitsToolBar is a QToolBar displaying and
controlling the limits of a PlotWidget. |
|
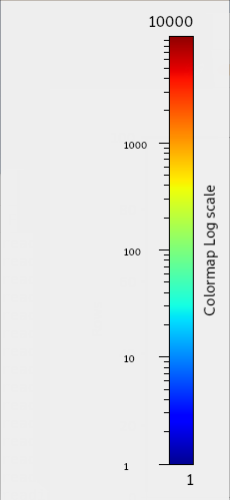
ColorBar.ColorBarWidget display colormap gradient and can be linked with a plot
to display the colormap |
|
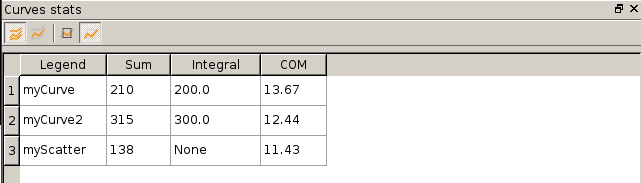
statsWidget.StatsWidget display statistics on plot’s items (curve, images…) |
silx.gui.plot3d Widgets
| Widget | Description |
|---|---|
|
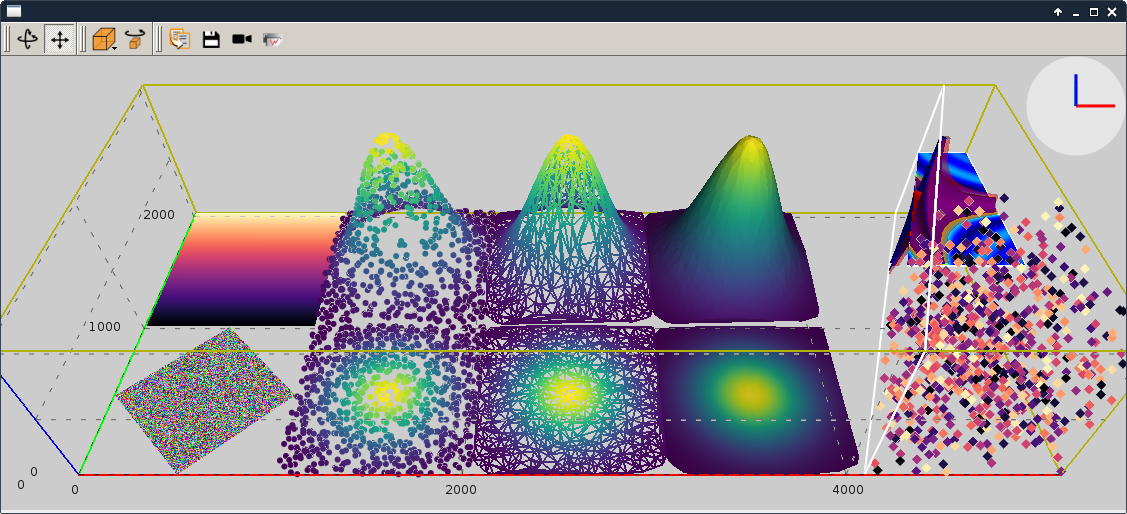
SceneWindow is a QMainWindow embedding a 3D data visualization SceneWidget
and associated toolbars.
It can display 2D images, 2D scatter data, 3D scatter data and 3D volumes with different visualizations.
See plot3dSceneWindow.py in silx.gui.plot3d sample code. |
|
SceneWidget is a Plot3DWidget providing a 3D scene for visualizing different kind of data.
It can display 2D images, 2D scatter data, 3D scatter data and 3D volumes with different visualizations.
See plot3dSceneWindow.py in silx.gui.plot3d sample code. |
|
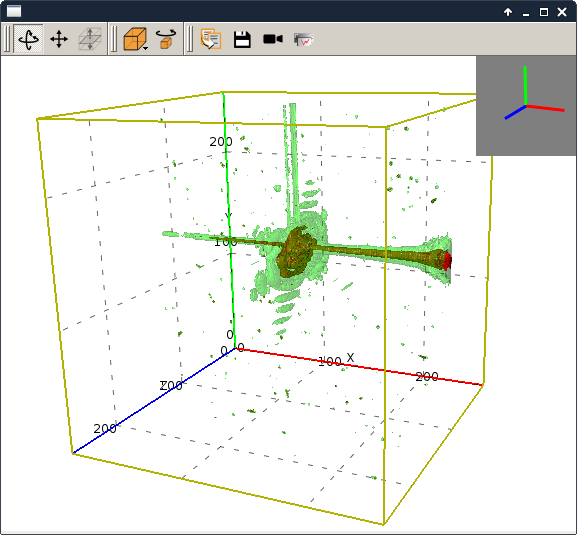
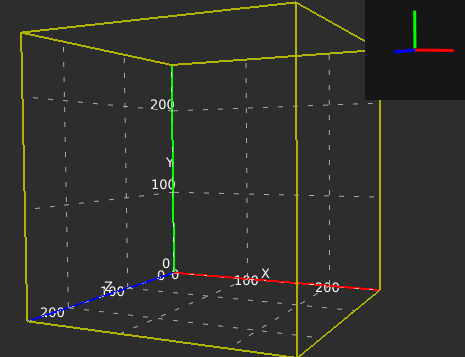
ScalarFieldView is a Plot3DWindow dedicated to display 3D scalar field.
It can display iso-surfaces and an interactive cutting plane. |
|
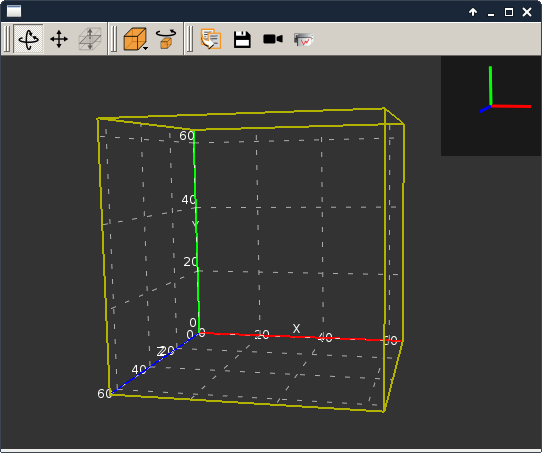
Plot3DWindow is a QMainWindow with a Plot3DWidget as central widget
and toolbars. |
|
Plot3DWidget is the base Qt widget providing an OpenGL 3D scene.
Other widgets are using this widget as the OpenGL scene canvas. |
|
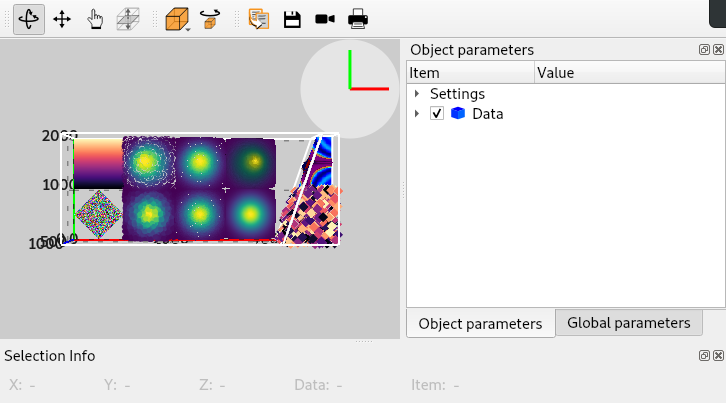
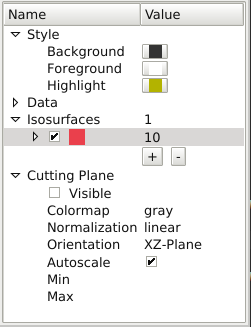
SFViewParamTree is a QTreeView widget that can be attached to a ScalarFieldView.
It displays current parameters of the ScalarFieldView and allows to modify it.
See silx.gui.plot3d sample code. |
Additional widgets:
| Widget | Description |
|---|---|

|
PositionInfoWidget displays the position
and value of selected data point in a SceneWidget. |
|
GroupPropertiesWidget
allows to reset properties of all items in a group in a SceneWidget. |
silx.gui.widgets Widgets
| Widget | Description |
|---|---|

|
FrameBrowser.FrameBrowser is a browser widget designed to
browse through a sequence of integers (e.g. the indices of an array) |

|
FrameBrowser.HorizontalSliderWithBrowser is a FrameBrowser
with an additional slider. |

|
RangeSlider is a slider with 2 thumbs dedicated
to the interactive selection of an interval. |

|
PeriodicTable.PeriodicCombo is a QComboBox widget designed to
select a single atomic element. |
|
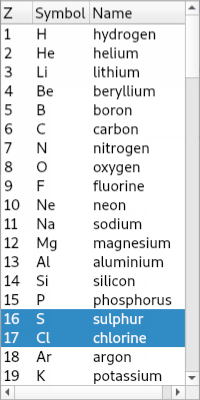
PeriodicTable.PeriodicList is a QTreeWidget designed to select one
or more atomic elements. |
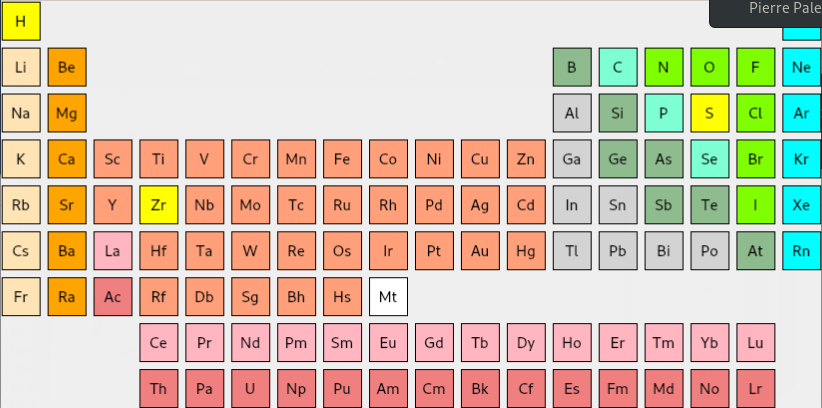
|
PeriodicTable.PeriodicTable is a periodic table widget designed to select one
or more atomic elements. |
|
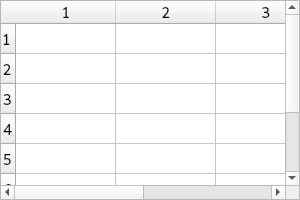
TableWidget.TableWidget and TableWidget.TableView inherit respectively
QTableWidget and QTableView, and add a context menu with cut/copy/paste
actions. |

|
WaitingPushButton is a QPushButton that can be graphically disabled,
for example to wait for a callback function to finish computing. |

|
ThreadPoolPushButton is a WaitingPushButton that executes a
callback in a thread. |