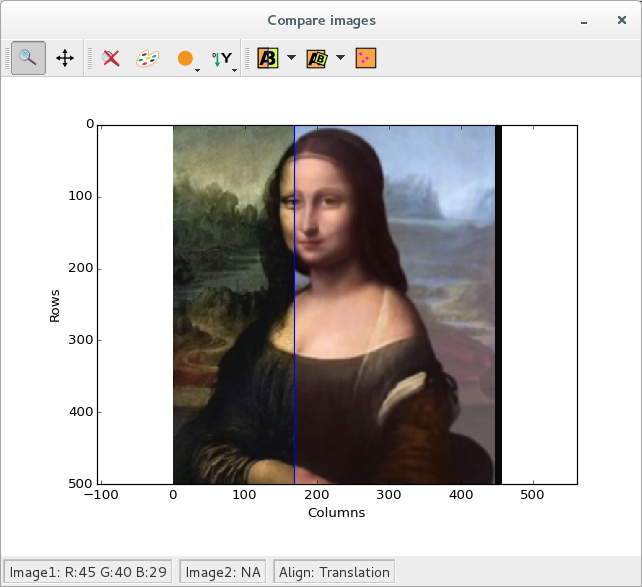
CompareImages: Plot 2 images to compare them
A widget dedicated to compare 2 images.
CompareImages class
-
class
CompareImages(parent=None, backend=None)[source]¶ Widget providing tools to compare 2 images.
Parameters: - parent (Union[qt.QWidget,None]) – Parent of this widget.
- backend (str or
BackendBase.BackendBase) – The backend to use, in: ‘matplotlib’ (default), ‘mpl’, ‘opengl’, ‘gl’, ‘none’ or aBackendBase.BackendBaseclass
-
class
VisualizationMode¶ Available visualization modes
-
class
AlignmentMode¶ Available alignment modes
-
sigConfigurationChanged¶ Emitted when the configuration of the widget (visualization mode, alignement mode…) have changed.
-
getPlot()[source]¶ Returns the plot which is used to display the images.
Return type: silx.gui.plot.PlotWidget
-
getColormap()[source]¶ Returns: colormap used for compare image Return type: silx.gui.colors.Colormap
-
getRawPixelData(x, y)[source]¶ Return the raw pixel of each image data from axes positions.
If the coordinate is outside of the image it returns None element in the tuple.
The pixel is reach from the raw data image without filter or transformation. But the coordinate x and y are in the reference of the current displayed mode.
Parameters: - x (float) – X-coordinate of the pixel in the current displayed plot
- y (float) – Y-coordinate of the pixel in the current displayed plot
Returns: A tuple of for each images containing pixel information. It could be a scalar value or an array in case of RGB/RGBA informations. It also could be a string containing information is some cases.
Return type: Tuple(Union[int,float,numpy.ndarray,str],Union[int,float,numpy.ndarray,str])
-
setVisualizationMode(mode)[source]¶ Set the visualization mode.
Parameters: mode (str) – New visualization to display the image comparison
-
setAlignmentMode(mode)[source]¶ Set the alignment mode.
Parameters: mode (str) – New alignement to apply to images
-
setKeypointsVisible(isVisible)[source]¶ Set keypoints visibility.
Parameters: isVisible (bool) – If True, keypoints are displayed (if some)
-
setData(image1, image2)[source]¶ Set images to compare.
Images can contains floating-point or integer values, or RGB and RGBA values, but should have comparable intensities.
RGB and RGBA images are provided as an array as [width,height,channels] of usigned integer 8-bits or floating-points between 0.0 to 1.0.
Parameters: - image1 (numpy.ndarray) – The first image
- image2 (numpy.ndarray) – The second image
-
setImage1(image1)[source]¶ Set image1 to be compared.
Images can contains floating-point or integer values, or RGB and RGBA values, but should have comparable intensities.
RGB and RGBA images are provided as an array as [width,height,channels] of usigned integer 8-bits or floating-points between 0.0 to 1.0.
Parameters: image1 (numpy.ndarray) – The first image
-
setImage2(image2)[source]¶ Set image2 to be compared.
Images can contains floating-point or integer values, or RGB and RGBA values, but should have comparable intensities.
RGB and RGBA images are provided as an array as [width,height,channels] of usigned integer 8-bits or floating-points between 0.0 to 1.0.
Parameters: image2 (numpy.ndarray) – The second image
-
getTransformation()[source]¶ Retuns the affine transformation applied to the second image to align it to the first image.
This result is only valid for sift alignment.
Return type: Union[None,AffineTransformation]