items: Plot primitives
This package provides classes that describes PlotWidget content.
Instances of those classes are returned by PlotWidget methods that give
access to its content such as PlotWidget.getCurve(), PlotWidget.getImage().
Item
All plot primitives inherits from Item as a common ground:
-
class
Item[source]¶ Bases:
silx.gui.qt._qt.QObjectDescription of an item of the plot
-
sigItemChanged¶ Signal emitted when the item has changed.
It provides a flag describing which property of the item has changed. See
ItemChangedTypefor flags description.
-
getPlot()[source]¶ Returns the ~silx.gui.plot.PlotWidget this item belongs to.
Return type: Union[PlotWidget,None]
-
getBounds()[source]¶ Returns the bounding box of this item in data coordinates
Returns: (xmin, xmax, ymin, ymax) or None Return type: 4-tuple of float or None
-
setVisible(visible)[source]¶ Set visibility of item.
Parameters: visible (bool) – True to display it, False otherwise
-
setName(name)[source]¶ Set the name of the item which is used as legend.
Parameters: name (str) – New name of the item Raises: RuntimeError – If item belongs to a PlotWidget.
-
getInfo(copy=True)[source]¶ Returns the info associated to this item
Parameters: copy (bool) – True to get a deepcopy, False otherwise.
-
getVisibleBounds() → Optional[Tuple[float, float, float, float]][source]¶ Returns visible bounds of the item bounding box in the plot area.
Returns: (xmin, xmax, ymin, ymax) in data coordinates of the visible area or None if item is not visible in the plot area. Return type: Union[List[float],None]
-
pick(x, y)[source]¶ Run picking test on this item
Parameters: - x (float) – The x pixel coord where to pick.
- y (float) – The y pixel coord where to pick.
Returns: None if not picked, else the picked position information
Return type: Union[None,PickingResult]
-
Curve
-
class
Curve[source]¶ Description of a curve
-
getAlpha()¶ Returns the opacity of the item
Return type: float in [0, 1.]
-
getColor()¶ Returns the RGBA color of the item
Return type: 4-tuple of float in [0, 1] or array of colors
-
getData(copy=True, displayed=False)¶ Returns the x, y values of the curve points and xerror, yerror
Parameters: - copy (bool) – True (Default) to get a copy, False to use internal representation (do not modify!)
- displayed (bool) – True to only get curve points that are displayed in the plot. Default: False Note: If plot has log scale, negative points are not displayed.
Returns: (x, y, xerror, yerror)
Return type: 4-tuple of numpy.ndarray
-
getHighlightedStyle()¶ Returns the highlighted style in use
Return type: CurveStyle
-
getLineStyle()¶ Return the type of the line
Type of line:
- ' '  no line
- '-'  solid line
- '--' dashed line
- '-.' dash-dot line
- ':'  dotted line
Return type: str
-
getLineWidth()¶ Return the curve line width in pixels
Return type: float
-
getSymbol()¶ Return the point marker type.
Marker type:
- 'o' circle
- '.' point
- ',' pixel
- '+' cross
- 'x' x-cross
- 'd' diamond
- 's' square
Return type: str
-
getSymbolSize()¶ Return the point marker size in points.
Return type: float
-
getXData(copy=True)¶ Returns the x coordinates of the data points
Parameters: copy – True (Default) to get a copy, False to use internal representation (do not modify!) Return type: numpy.ndarray
-
getXErrorData(copy=True)¶ Returns the x error of the points
Parameters: copy – True (Default) to get a copy, False to use internal representation (do not modify!) Return type: numpy.ndarray, float or None
-
getXLabel()¶ Return the X axis label associated to this curve
Return type: str or None
-
getYAxis()¶ Returns the Y axis this curve belongs to.
Either ‘left’ or ‘right’.
Return type: str
-
getYData(copy=True)¶ Returns the y coordinates of the data points
Parameters: copy – True (Default) to get a copy, False to use internal representation (do not modify!) Return type: numpy.ndarray
-
getYErrorData(copy=True)¶ Returns the y error of the points
Parameters: copy – True (Default) to get a copy, False to use internal representation (do not modify!) Return type: numpy.ndarray, float or None
-
getYLabel()¶ Return the Y axis label associated to this curve
Return type: str or None
-
isFill()¶ Returns whether the item is filled or not.
Return type: bool
-
isHighlighted()¶ Returns True if curve is highlighted.
Return type: bool
-
setAlpha(alpha)¶ Set the opacity of the item
Note
If the colormap already has some transparency, this alpha adds additional transparency. The alpha channel of the colormap is multiplied by this value.
Parameters: alpha (float) – Opacity of the item, between 0 (full transparency) and 1. (full opacity)
-
setColor(color, copy=True)¶ Set item color
Parameters: - color (str ("#RRGGBB") or (npoints, 4) unsigned byte array or one of the predefined color names defined in colors.py) – color(s) to be used
- copy (bool) – True (Default) to get a copy, False to use internal representation (do not modify!)
-
setFill(fill)¶ Set whether to fill the item or not.
Parameters: fill (bool) –
-
setHighlighted(highlighted)¶ Set the highlight state of the curve
Parameters: highlighted (bool) –
-
setHighlightedStyle(style)¶ Set the style to use for highlighting
Parameters: style (CurveStyle) – New style to use
-
setLineStyle(style)¶ Set the style of the curve line.
See
getLineStyle().Parameters: style (str) – Line style
-
setLineWidth(width)¶ Set the width in pixel of the curve line
See
getLineWidth().Parameters: width (float) – Width in pixels
-
setSymbol(symbol)¶ Set the marker type
See
getSymbol().Parameters: symbol (str) – Marker type or marker name
-
setSymbolSize(size)¶ Set the point marker size in points.
See
getSymbolSize().Parameters: symbol (str) – Marker type
-
setYAxis(yaxis)¶ Set the Y axis this curve belongs to.
Parameters: yaxis (str) – ‘left’ or ‘right’
-
getCurrentStyle()[source]¶ Returns the current curve style.
Curve style depends on curve highlighting
Return type: CurveStyle
-
setData(x, y, xerror=None, yerror=None, baseline=None, copy=True)[source]¶ Set the data of the curve.
Parameters: - x (numpy.ndarray) – The data corresponding to the x coordinates.
- y (numpy.ndarray) – The data corresponding to the y coordinates.
- xerror (A float, or a numpy.ndarray of float32. If it is an array, it can either be a 1D array of same length as the data or a 2D array with 2 rows of same length as the data: row 0 for positive errors, row 1 for negative errors.) – Values with the uncertainties on the x values
- yerror (A float, or a numpy.ndarray of float32. See xerror.) – Values with the uncertainties on the y values.
- baseline (Union[None,float,numpy.ndarray]) – curve baseline
- copy (bool) – True make a copy of the data (default), False to use provided arrays.
-
-
class
CurveStyle(color=None, linestyle=None, linewidth=None, symbol=None, symbolsize=None)[source]¶ Object storing the style of a curve.
Set a value to None to use the default
Parameters: - color – Color
- linestyle (Union[str,None]) – Style of the line
- linewidth (Union[float,None]) – Width of the line
- symbol (Union[str,None]) – Symbol for markers
- symbolsize (Union[float,None]) – Size of the markers
-
getColor(copy=True)[source]¶ Returns the color or None if not set.
Parameters: copy (bool) – True to get a copy (default), False to get internal representation (do not modify!) Return type: Union[List[float],None]
-
getLineStyle()[source]¶ Return the type of the line or None if not set.
Type of line:
- ' '  no line
- '-'  solid line
- '--' dashed line
- '-.' dash-dot line
- ':'  dotted line
Return type: Union[str,None]
-
getLineWidth()[source]¶ Return the curve line width in pixels or None if not set.
Return type: Union[float,None]
Images
-
class
ImageData[source]¶ Description of a data image with a colormap
-
getRgbaImageData(copy=True)[source]¶ Get the displayed RGB(A) image
Returns: Array of uint8 of shape (height, width, 4) Return type: numpy.ndarray
-
getAlternativeImageData(copy=True)[source]¶ Get the optional RGBA image that is displayed instead of the data
Parameters: copy (bool) – True (Default) to get a copy, False to use internal representation (do not modify!) Return type: Union[None,numpy.ndarray]
-
getAlpha()¶ Returns the opacity of the item
Return type: float in [0, 1.]
-
getColormap()¶ Return the used colormap
-
getData(copy=True)¶ Returns the image data
Parameters: copy (bool) – True (Default) to get a copy, False to use internal representation (do not modify!) Return type: numpy.ndarray
-
getOrigin()¶ Returns the offset from origin at which to display the image.
Return type: 2-tuple of float
-
getScale()¶ Returns the scale of the image in data coordinates.
Return type: 2-tuple of float
-
isDraggable()¶ Returns true if image is draggable
Return type: bool
-
setAlpha(alpha)¶ Set the opacity of the item
Note
If the colormap already has some transparency, this alpha adds additional transparency. The alpha channel of the colormap is multiplied by this value.
Parameters: alpha (float) – Opacity of the item, between 0 (full transparency) and 1. (full opacity)
-
setColormap(colormap)¶ Set the colormap of this item
Parameters: colormap (silx.gui.colors.Colormap) – colormap description
-
setOrigin(origin)¶ Set the offset from origin at which to display the image.
Parameters: origin (float or 2-tuple of float) – (ox, oy) Offset from origin
-
setScale(scale)¶ Set the scale of the image
Parameters: scale (float or 2-tuple of float) – (sx, sy) Scale of the image
-
-
class
ImageRgba[source]¶ Description of an RGB(A) image
-
getRgbaImageData(copy=True)[source]¶ Get the displayed RGB(A) image
Returns: numpy.ndarray of uint8 of shape (height, width, 4)
-
getAlpha()¶ Returns the opacity of the item
Return type: float in [0, 1.]
-
getData(copy=True)¶ Returns the image data
Parameters: copy (bool) – True (Default) to get a copy, False to use internal representation (do not modify!) Return type: numpy.ndarray
-
getOrigin()¶ Returns the offset from origin at which to display the image.
Return type: 2-tuple of float
-
getScale()¶ Returns the scale of the image in data coordinates.
Return type: 2-tuple of float
-
isDraggable()¶ Returns true if image is draggable
Return type: bool
-
setAlpha(alpha)¶ Set the opacity of the item
Note
If the colormap already has some transparency, this alpha adds additional transparency. The alpha channel of the colormap is multiplied by this value.
Parameters: alpha (float) – Opacity of the item, between 0 (full transparency) and 1. (full opacity)
-
setOrigin(origin)¶ Set the offset from origin at which to display the image.
Parameters: origin (float or 2-tuple of float) – (ox, oy) Offset from origin
-
setScale(scale)¶ Set the scale of the image
Parameters: scale (float or 2-tuple of float) – (sx, sy) Scale of the image
-
Scatter
-
class
Scatter[source]¶ Description of a scatter
-
getValueData(copy=True)[source]¶ Returns the value assigned to the scatter data points.
Parameters: copy – True (Default) to get a copy, False to use internal representation (do not modify!) Return type: numpy.ndarray
-
getAlpha()¶ Returns the opacity of the item
Return type: float in [0, 1.]
-
getColormap()¶ Return the used colormap
-
getData(copy=True, displayed=False)[source]¶ Returns the x, y coordinates and the value of the data points
Parameters: - copy – True (Default) to get a copy, False to use internal representation (do not modify!)
- displayed (bool) – True to only get curve points that are displayed in the plot. Default: False. Note: If plot has log scale, negative points are not displayed.
Returns: (x, y, value, xerror, yerror)
Return type: 5-tuple of numpy.ndarray
-
getSymbol()¶ Return the point marker type.
Marker type:
- 'o' circle
- '.' point
- ',' pixel
- '+' cross
- 'x' x-cross
- 'd' diamond
- 's' square
Return type: str
-
getSymbolSize()¶ Return the point marker size in points.
Return type: float
-
getXData(copy=True)¶ Returns the x coordinates of the data points
Parameters: copy – True (Default) to get a copy, False to use internal representation (do not modify!) Return type: numpy.ndarray
-
getXErrorData(copy=True)¶ Returns the x error of the points
Parameters: copy – True (Default) to get a copy, False to use internal representation (do not modify!) Return type: numpy.ndarray, float or None
-
getYData(copy=True)¶ Returns the y coordinates of the data points
Parameters: copy – True (Default) to get a copy, False to use internal representation (do not modify!) Return type: numpy.ndarray
-
getYErrorData(copy=True)¶ Returns the y error of the points
Parameters: copy – True (Default) to get a copy, False to use internal representation (do not modify!) Return type: numpy.ndarray, float or None
-
setAlpha(alpha)¶ Set the opacity of the item
Note
If the colormap already has some transparency, this alpha adds additional transparency. The alpha channel of the colormap is multiplied by this value.
Parameters: alpha (float) – Opacity of the item, between 0 (full transparency) and 1. (full opacity)
-
setColormap(colormap)¶ Set the colormap of this item
Parameters: colormap (silx.gui.colors.Colormap) – colormap description
-
setSymbol(symbol)¶ Set the marker type
See
getSymbol().Parameters: symbol (str) – Marker type or marker name
-
setSymbolSize(size)¶ Set the point marker size in points.
See
getSymbolSize().Parameters: symbol (str) – Marker type
-
setData(x, y, value, xerror=None, yerror=None, alpha=None, copy=True)[source]¶ Set the data of the scatter.
Parameters: - x (numpy.ndarray) – The data corresponding to the x coordinates.
- y (numpy.ndarray) – The data corresponding to the y coordinates.
- value (numpy.ndarray) – The data corresponding to the value of the data points.
- xerror (A float, or a numpy.ndarray of float32. If it is an array, it can either be a 1D array of same length as the data or a 2D array with 2 rows of same length as the data: row 0 for positive errors, row 1 for negative errors.) – Values with the uncertainties on the x values
- yerror (A float, or a numpy.ndarray of float32. See xerror.) – Values with the uncertainties on the y values
- alpha (A float, or a numpy.ndarray of float32) – Values with the transparency (between 0 and 1)
- copy (bool) – True make a copy of the data (default), False to use provided arrays.
-
Histogram
-
class
Histogram[source]¶ Description of an histogram
-
getValueData(copy=True)[source]¶ The values of the histogram
Parameters: copy – True (Default) to get a copy, False to use internal representation (do not modify!) Returns: The values of the histogram Return type: numpy.ndarray
-
getBinEdgesData(copy=True)[source]¶ The bin edges of the histogram (number of histogram values + 1)
Parameters: copy – True (Default) to get a copy, False to use internal representation (do not modify!) Returns: The bin edges of the histogram Return type: numpy.ndarray
-
getAlpha()¶ Returns the opacity of the item
Return type: float in [0, 1.]
-
getColor()¶ Returns the RGBA color of the item
Return type: 4-tuple of float in [0, 1] or array of colors
-
getData(copy=True)[source]¶ Return the histogram values, bin edges and baseline
Parameters: copy – True (Default) to get a copy, False to use internal representation (do not modify!) Returns: (N histogram value, N+1 bin edges) Return type: 2-tuple of numpy.nadarray
-
getLineStyle()¶ Return the type of the line
Type of line:
- ' ' no line - '-' solid line - '--' dashed line - '-.' dash-dot line - ':' dotted line
Return type: str
-
getLineWidth()¶ Return the curve line width in pixels
Return type: float
-
getYAxis()¶ Returns the Y axis this curve belongs to.
Either ‘left’ or ‘right’.
Return type: str
-
isFill()¶ Returns whether the item is filled or not.
Return type: bool
-
setAlpha(alpha)¶ Set the opacity of the item
Note
If the colormap already has some transparency, this alpha adds additional transparency. The alpha channel of the colormap is multiplied by this value.
Parameters: alpha (float) – Opacity of the item, between 0 (full transparency) and 1. (full opacity)
-
setColor(color, copy=True)¶ Set item color
Parameters: - color (str ("#RRGGBB") or (npoints, 4) unsigned byte array or one of the predefined color names defined in colors.py) – color(s) to be used
- copy (bool) – True (Default) to get a copy, False to use internal representation (do not modify!)
-
setFill(fill)¶ Set whether to fill the item or not.
Parameters: fill (bool) –
-
setLineStyle(style)¶ Set the style of the curve line.
See
getLineStyle().Parameters: style (str) – Line style
-
setLineWidth(width)¶ Set the width in pixel of the curve line
See
getLineWidth().Parameters: width (float) – Width in pixels
-
setYAxis(yaxis)¶ Set the Y axis this curve belongs to.
Parameters: yaxis (str) – ‘left’ or ‘right’
-
setData(histogram, edges, align='center', baseline=None, copy=True)[source]¶ Set the histogram values and bin edges.
Parameters: - histogram (numpy.ndarray) – The values of the histogram.
- edges (numpy.ndarray) – The bin edges of the histogram. If histogram and edges have the same length, the bin edges are computed according to the align parameter.
- align (str) – In case histogram values and edges have the same length N, the N+1 bin edges are computed according to the alignment in: ‘center’ (default), ‘left’, ‘right’.
- baseline (Union[None,float,numpy.ndarray]) – histogram baseline
- copy (bool) – True make a copy of the data (default), False to use provided arrays.
-
Markers
-
class
Marker[source]¶ Description of a marker
-
getConstraint()¶ Returns the dragging constraint of this item
-
getPosition()¶ Returns the (x, y) position of the marker in data coordinates
Return type: 2-tuple of float or None
-
getSymbol()¶ Return the point marker type.
Marker type:
- 'o' circle
- '.' point
- ',' pixel
- '+' cross
- 'x' x-cross
- 'd' diamond
- 's' square
Return type: str
-
getSymbolSize()¶ Return the point marker size in points.
Return type: float
-
getText()¶ Returns marker text.
Return type: str
-
getXPosition()¶ Returns the X position of the marker line in data coordinates
Return type: float or None
-
getYPosition()¶ Returns the Y position of the marker line in data coordinates
Return type: float or None
-
setPosition(x, y)¶ Set marker position in data coordinates
Constraint are applied if any.
Parameters: - x (float) – X coordinates in data frame
- y (float) – Y coordinates in data frame
-
setSymbol(symbol)¶ Set the marker type
See
getSymbol().Parameters: symbol (str) – Marker type or marker name
-
setSymbolSize(size)¶ Set the point marker size in points.
See
getSymbolSize().Parameters: symbol (str) – Marker type
-
setText(text)¶ Set the text of the marker.
Parameters: text (str) – The text to use
-
-
class
XMarker[source]¶ Description of a marker
-
setPosition(x, y)[source]¶ Set marker line position in data coordinates
Constraint are applied if any.
Parameters: - x (float) – X coordinates in data frame
- y (float) – Y coordinates in data frame
-
getConstraint()¶ Returns the dragging constraint of this item
-
getPosition()¶ Returns the (x, y) position of the marker in data coordinates
Return type: 2-tuple of float or None
-
getText()¶ Returns marker text.
Return type: str
-
getXPosition()¶ Returns the X position of the marker line in data coordinates
Return type: float or None
-
getYPosition()¶ Returns the Y position of the marker line in data coordinates
Return type: float or None
-
setText(text)¶ Set the text of the marker.
Parameters: text (str) – The text to use
-
-
class
YMarker[source]¶ Description of a marker
-
getConstraint()¶ Returns the dragging constraint of this item
-
getPosition()¶ Returns the (x, y) position of the marker in data coordinates
Return type: 2-tuple of float or None
-
getText()¶ Returns marker text.
Return type: str
-
getXPosition()¶ Returns the X position of the marker line in data coordinates
Return type: float or None
-
getYPosition()¶ Returns the Y position of the marker line in data coordinates
Return type: float or None
-
setText(text)¶ Set the text of the marker.
Parameters: text (str) – The text to use
-
Shapes
-
class
Shape(type_)[source]¶ Description of a shape item
Parameters: type (str) – The type of shape in: ‘hline’, ‘polygon’, ‘rectangle’, ‘vline’, ‘polylines’ -
setOverlay(overlay)[source]¶ Set the overlay state of the shape
Parameters: overlay (bool) – True to make it an overlay
-
getType()[source]¶ Returns the type of shape to draw.
One of: ‘hline’, ‘polygon’, ‘rectangle’, ‘vline’, ‘polylines’
Return type: str
-
getPoints(copy=True)[source]¶ Get the control points of the shape.
Parameters: copy (bool) – True (Default) to get a copy, False to use internal representation (do not modify!) Returns: Array of point coordinates Return type: numpy.ndarray with 2 dimensions
-
setPoints(points, copy=True)[source]¶ Set the point coordinates
Parameters: - points (numpy.ndarray) – Array of point coordinates
- copy (bool) – True (Default) to get a copy, False to use internal representation (do not modify!)
Returns:
-
getColor()¶ Returns the RGBA color of the item
Return type: 4-tuple of float in [0, 1] or array of colors
-
isFill()¶ Returns whether the item is filled or not.
Return type: bool
-
setColor(color, copy=True)¶ Set item color
Parameters: - color (str ("#RRGGBB") or (npoints, 4) unsigned byte array or one of the predefined color names defined in colors.py) – color(s) to be used
- copy (bool) – True (Default) to get a copy, False to use internal representation (do not modify!)
-
setFill(fill)¶ Set whether to fill the item or not.
Parameters: fill (bool) –
-
Item changed signal
Plot items emit a Item.sigItemChanged signal when their values are updated.
This signal provides a flag in the following enumeration describing the modified value:
-
class
ItemChangedType[source]¶ Type of modification provided by
Item.sigItemChangedsignal.-
VISIBLE= 'visibleChanged'¶ Item’s visibility changed flag.
-
ZVALUE= 'zValueChanged'¶ Item’s Z value changed flag.
-
COLORMAP= 'colormapChanged'¶ Item’s colormap changed flag.
This is emitted both when setting a new colormap and when the current colormap object is updated.
-
SYMBOL= 'symbolChanged'¶ Item’s symbol changed flag.
-
SYMBOL_SIZE= 'symbolSizeChanged'¶ Item’s symbol size changed flag.
-
LINE_WIDTH= 'lineWidthChanged'¶ Item’s line width changed flag.
-
LINE_STYLE= 'lineStyleChanged'¶ Item’s line style changed flag.
-
COLOR= 'colorChanged'¶ Item’s color changed flag.
-
LINE_BG_COLOR= 'lineBgColorChanged'¶ Item’s line background color changed flag.
-
YAXIS= 'yAxisChanged'¶ Item’s Y axis binding changed flag.
-
FILL= 'fillChanged'¶ Item’s fill changed flag.
-
ALPHA= 'alphaChanged'¶ Item’s transparency alpha changed flag.
-
DATA= 'dataChanged'¶ Item’s data changed flag
-
MASK= 'maskChanged'¶ Item’s mask changed flag
-
HIGHLIGHTED= 'highlightedChanged'¶ Item’s highlight state changed flag.
-
HIGHLIGHTED_COLOR= 'highlightedColorChanged'¶ Deprecated, use HIGHLIGHTED_STYLE instead.
-
HIGHLIGHTED_STYLE= 'highlightedStyleChanged'¶ Item’s highlighted style changed flag.
-
SCALE= 'scaleChanged'¶ Item’s scale changed flag.
-
TEXT= 'textChanged'¶ Item’s text changed flag.
-
POSITION= 'positionChanged'¶ Item’s position changed flag.
This is emitted when a marker position changed and when an image origin changed.
-
OVERLAY= 'overlayChanged'¶ Item’s overlay state changed flag.
-
VISUALIZATION_MODE= 'visualizationModeChanged'¶ Item’s visualization mode changed flag.
-
COMPLEX_MODE= 'complexModeChanged'¶ Item’s complex data visualization mode changed flag.
-
NAME= 'nameChanged'¶ Item’s name changed flag.
-
EDITABLE= 'editableChanged'¶ Item’s editable state changed flags.
-
SELECTABLE= 'selectableChanged'¶ Item’s selectable state changed flags.
-
Axis
-
class
Axis(plot)[source]¶ This class describes and controls a plot axis.
Note: This is an abstract class.
-
LINEAR= 'linear'¶ Constant defining a linear scale
-
LOGARITHMIC= 'log'¶ Constant defining a logarithmic scale
-
sigInvertedChanged¶ Signal emitted when axis orientation has changed
-
sigScaleChanged¶ Signal emitted when axis scale has changed
-
sigAutoScaleChanged¶ Signal emitted when axis autoscale has changed
-
sigLimitsChanged¶ Signal emitted when axis limits have changed
-
getLimits()[source]¶ Get the limits of this axis.
Returns: Minimum and maximum values of this axis as tuple
-
setLimits(vmin, vmax)[source]¶ Set this axis limits.
Parameters: - vmin (float) – minimum axis value
- vmax (float) – maximum axis value
-
isInverted()[source]¶ Return True if the axis is inverted (top to bottom for the y-axis), False otherwise. It is always False for the X axis.
Return type: bool
-
setInverted(isInverted)[source]¶ Set the axis orientation.
This is only available for the Y axis.
Parameters: flag (bool) – True for Y axis going from top to bottom, False for Y axis going from bottom to top
-
getLabel()[source]¶ Return the current displayed label of this axis.
Parameters: axis (str) – The Y axis for which to get the label (left or right) Return type: str
-
setLabel(label)[source]¶ Set the label displayed on the plot for this axis.
The provided label can be temporarily replaced by the label of the active curve if any.
Parameters: label (str) – The axis label
-
setScale(scale)[source]¶ Set the scale to be used by this axis.
Parameters: scale (str) – Name of the scale (“log”, or “linear”)
-
getTimeZone()[source]¶ Sets tzinfo that is used if this axis plots date times.
None means the datetimes are interpreted as local time.
Return type: datetime.tzinfo of None.
-
setTimeZone(tz)[source]¶ Sets tzinfo that is used if this axis’ tickMode is TIME_SERIES
The tz must be a descendant of the datetime.tzinfo class, “UTC” or None. Use None to let the datetimes be interpreted as local time. Use the string “UTC” to let the date datetimes be in UTC time.
Parameters: tz – datetime.tzinfo, “UTC” or None.
-
setTickMode(tickMode)[source]¶ Determines if axis ticks are number or datetimes.
Parameters: tickMode (TickMode) – tick mode enum.
-
setAutoScale(flag=True)[source]¶ Set the axis limits adjusting behavior of
resetZoom().Parameters: flag (bool) – True to resize limits automatically, False to disable it.
-
setLimitsConstraints(minPos=None, maxPos=None)[source]¶ Set a constraint on the position of the axes.
Parameters: - minPos (float) – Minimum allowed axis value.
- maxPos (float) – Maximum allowed axis value.
Returns: True if the constaints was updated
Return type: bool
-
setRangeConstraints(minRange=None, maxRange=None)[source]¶ Set a constraint on the position of the axes.
Parameters: - minRange (float) – Minimum allowed left-to-right span across the view
- maxRange (float) – Maximum allowed left-to-right span across the view
Returns: True if the constaints was updated
Return type: bool
-
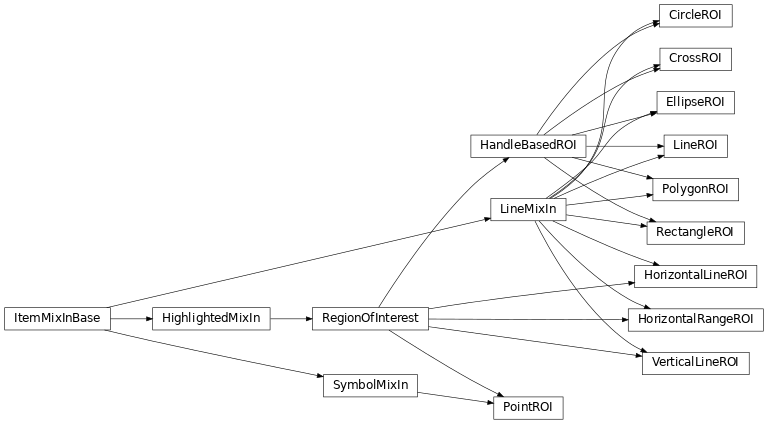
roi: Regions of Interest
This module provides ROI item for the PlotWidget.
-
class
PointROI(parent=None)[source]¶ A ROI identifying a point in a 2D plot.
-
SHORT_NAME= 'point'¶ Metadata for this kind of ROI
-
setFirstShapePoints(points)[source]¶ “Initialize the ROI using the points from the first interaction.
This interaction is constrained by the plot API and only supports few shapes.
-
-
class
CrossROI(parent=None)[source]¶ A ROI identifying a point in a 2D plot and displayed as a cross
-
SHORT_NAME= 'cross'¶ Metadata for this kind of ROI
-
setFirstShapePoints(points)[source]¶ “Initialize the ROI using the points from the first interaction.
This interaction is constrained by the plot API and only supports few shapes.
-
-
class
LineROI(parent=None)[source]¶ A ROI identifying a line in a 2D plot.
This ROI provides 1 anchor for each boundary of the line, plus an center in the center to translate the full ROI.
-
SHORT_NAME= 'line'¶ Metadata for this kind of ROI
-
setFirstShapePoints(points)[source]¶ “Initialize the ROI using the points from the first interaction.
This interaction is constrained by the plot API and only supports few shapes.
-
setEndPoints(startPoint, endPoint)[source]¶ Set this line location using the ending points
Parameters: - startPoint (numpy.ndarray) – Staring bounding point of the line
- endPoint (numpy.ndarray) – Ending bounding point of the line
-
getEndPoints()[source]¶ Returns bounding points of this ROI.
Return type: Tuple(numpy.ndarray,numpy.ndarray)
-
-
class
HorizontalLineROI(parent=None)[source]¶ A ROI identifying an horizontal line in a 2D plot.
-
SHORT_NAME= 'hline'¶ Metadata for this kind of ROI
-
setFirstShapePoints(points)[source]¶ “Initialize the ROI using the points from the first interaction.
This interaction is constrained by the plot API and only supports few shapes.
-
-
class
VerticalLineROI(parent=None)[source]¶ A ROI identifying a vertical line in a 2D plot.
-
SHORT_NAME= 'vline'¶ Metadata for this kind of ROI
-
setFirstShapePoints(points)[source]¶ “Initialize the ROI using the points from the first interaction.
This interaction is constrained by the plot API and only supports few shapes.
-
-
class
RectangleROI(parent=None)[source]¶ A ROI identifying a rectangle in a 2D plot.
This ROI provides 1 anchor for each corner, plus an anchor in the center to translate the full ROI.
-
SHORT_NAME= 'rectangle'¶ Metadata for this kind of ROI
-
setFirstShapePoints(points)[source]¶ “Initialize the ROI using the points from the first interaction.
This interaction is constrained by the plot API and only supports few shapes.
-
getCenter()[source]¶ Returns the central point of this rectangle
Return type: numpy.ndarray([float,float])
-
getOrigin()[source]¶ Returns the corner point with the smaller coordinates
Return type: numpy.ndarray([float,float])
-
setOrigin(position)[source]¶ Set the origin position of this ROI
Parameters: position (numpy.ndarray) – Location of the smaller corner of the ROI
-
setSize(size)[source]¶ Set the size of this ROI
Parameters: size (numpy.ndarray) – Size of the center of the ROI
-
setCenter(position)[source]¶ Set the size of this ROI
Parameters: position (numpy.ndarray) – Location of the center of the ROI
-
-
class
CircleROI(parent=None)[source]¶ A ROI identifying a circle in a 2D plot.
This ROI provides 1 anchor at the center to translate the circle, and one anchor on the perimeter to change the radius.
-
SHORT_NAME= 'circle'¶ Metadata for this kind of ROI
-
setFirstShapePoints(points)[source]¶ “Initialize the ROI using the points from the first interaction.
This interaction is constrained by the plot API and only supports few shapes.
-
getCenter()[source]¶ Returns the central point of this rectangle
Return type: numpy.ndarray([float,float])
-
setCenter(position)[source]¶ Set the center point of this ROI
Parameters: position (numpy.ndarray) – Location of the center of the circle
-
-
class
EllipseROI(parent=None)[source]¶ A ROI identifying an oriented ellipse in a 2D plot.
This ROI provides 1 anchor at the center to translate the circle, and two anchors on the perimeter to modify the major-radius and minor-radius. These two anchors also allow to change the orientation.
-
SHORT_NAME= 'ellipse'¶ Metadata for this kind of ROI
-
setFirstShapePoints(points)[source]¶ “Initialize the ROI using the points from the first interaction.
This interaction is constrained by the plot API and only supports few shapes.
-
getCenter()[source]¶ Returns the central point of this rectangle
Return type: numpy.ndarray([float,float])
-
getOrientation()[source]¶ Return angle in radians between the horizontal (X) axis and the major axis of the ellipse in [0, 2*pi[
Return type: float:
-
setCenter(center)[source]¶ Set the center point of this ROI
Parameters: position (numpy.ndarray) – Coordinates (X, Y) of the center of the ellipse
-
setMajorRadius(radius)[source]¶ Set the half-diameter of the major axis of the ellipse.
Parameters: radius (float) – Major radius of the ellipsis. Must be a positive value.
-
setMinorRadius(radius)[source]¶ Set the half-diameter of the minor axis of the ellipse.
Parameters: radius (float) – Minor radius of the ellipsis. Must be a positive value.
-
setOrientation(orientation)[source]¶ Rotate the ellipse
Parameters: orientation (float) – Angle in radians between the horizontal and the major axis. Returns:
-
setGeometry(center=None, radius=None, orientation=None)[source]¶ Parameters: - center – (X, Y) coordinates
- majorRadius (float) –
- minorRadius (float) –
- orientation (float) – angle in radians between the major axis and the horizontal
Returns:
-
-
class
PolygonROI(parent=None)[source]¶ A ROI identifying a closed polygon in a 2D plot.
This ROI provides 1 anchor for each point of the polygon.
-
SHORT_NAME= 'polygon'¶ Metadata for this kind of ROI
-
setFirstShapePoints(points)[source]¶ “Initialize the ROI using the points from the first interaction.
This interaction is constrained by the plot API and only supports few shapes.
-
setPoints(points)[source]¶ Set the position of this ROI
Parameters: pos (numpy.ndarray) – 2d-coordinate of this point
-
-
class
HorizontalRangeROI(parent=None)[source]¶ A ROI identifying an horizontal range in a 1D plot.
-
setFirstShapePoints(points)[source]¶ “Initialize the ROI using the points from the first interaction.
This interaction is constrained by the plot API and only supports few shapes.
-