DataViewerFrame: Widget to display any kind of data
This module contains a DataViewer with a view selector.
-
class
DataViewerFrame(parent=None)[source]¶ A
DataViewerwith a view selector.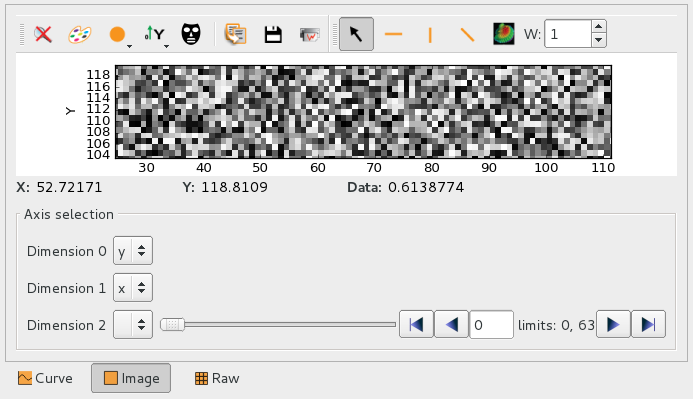
This widget provides the same API as
DataViewer. Therefore, for more documentation, take a look at the documentation of the classDataViewer.import numpy data = numpy.random.rand(500,500) viewer = DataViewerFrame() viewer.setData(data) viewer.setVisible(True)
-
displayedViewChanged¶ Emitted when the displayed view changes
-
dataChanged¶ Emitted when the data changes
-
setGlobalHooks(hooks)[source]¶ Set a data view hooks for all the views
Parameters: context (DataViewHooks) – The hooks to use
-
currentAvailableViews()[source]¶ Returns the list of available views for the current data
Return type: List[DataView]
-
createDefaultViews(parent=None)[source]¶ Create and returns available views which can be displayed by default by the data viewer. It is called internally by the widget. It can be overwriten to provide a different set of viewers.
Parameters: parent (QWidget) – QWidget parent of the views Return type: List[silx.gui.data.DataViews.DataView]
-
addView(view)[source]¶ Allow to add a view to the dataview.
If the current data support this view, it will be displayed.
Parameters: view (DataView) – A dataview
-
removeView(view)[source]¶ Allow to remove a view which was available from the dataview.
If the view was displayed, the widget will be updated.
Parameters: view (DataView) – A dataview
-
setData(data)[source]¶ Set the data to view.
It mostly can be a h5py.Dataset or a numpy.ndarray. Other kind of objects will be displayed as text rendering.
Parameters: data (numpy.ndarray) – The data.
-
setDisplayMode(modeId)[source]¶ Set the displayed view using display mode.
Change the displayed view according to the requested mode.
Parameters: modeId (int) – Display mode, one of
- EMPTY_MODE: display nothing
- PLOT1D_MODE: display the data as a curve
- PLOT2D_MODE: display the data as an image
- TEXT_MODE: display the data as a text
- ARRAY_MODE: display the data as a table
-