Sample Code
All sample codes can be downloaded as a zip file: silx_examples.zip.
silx.gui sample code
silx.gui.icons
| Source | Screenshot | Description |
|---|---|---|
icons.py |
Display icons and animated icons provided by silx. |
silx.gui.data and silx.gui.hdf5
| Source | Screenshot | Description |
|---|---|---|
customHdf5TreeModel.py |
|
Qt Hdf5 widget examples |
customDataView.py |
|
Qt data view example |
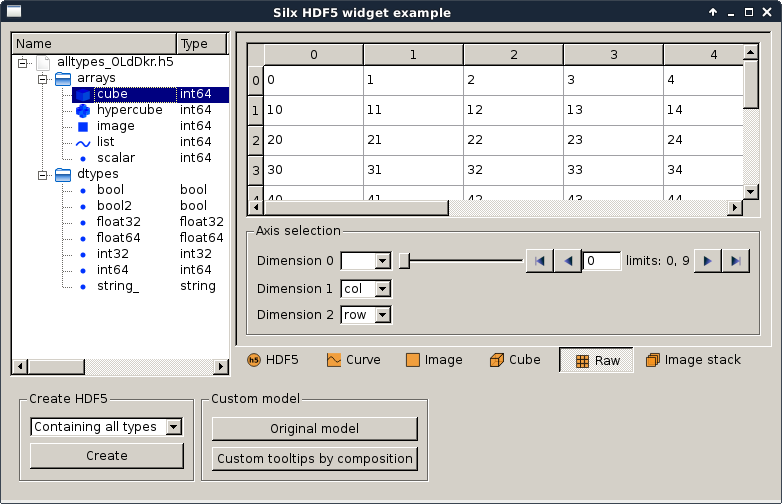
hdf5widget.py |
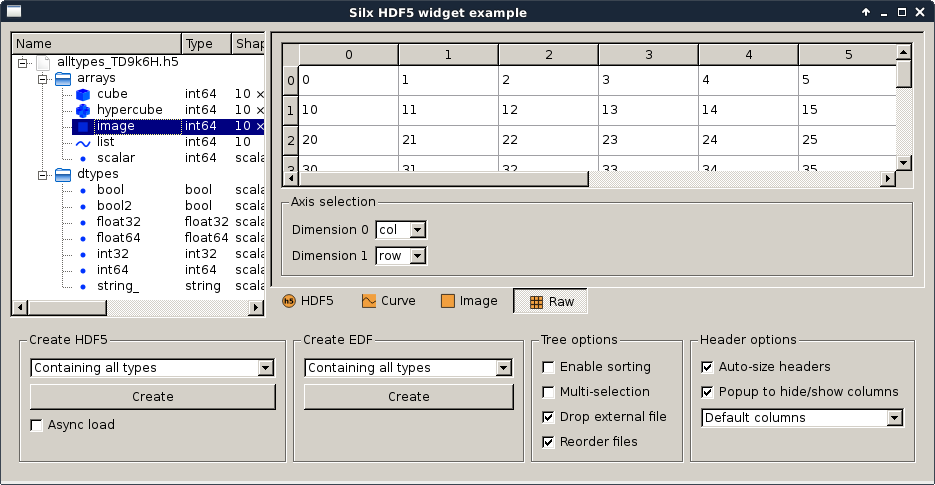
|
Qt Hdf5 widget examples Note This module has a dependency on the h5py library, which is not a mandatory dependency for silx. You might need to install it if you don’t already have it. |
silx.gui.dialog
| Source | Screenshot | Description |
|---|---|---|
fileDialog.py |
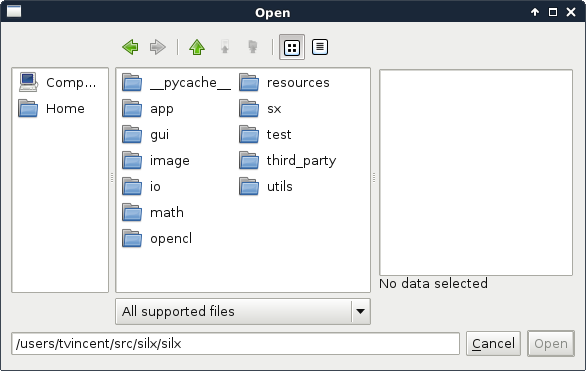
|
Example for the use of the ImageFileDialog. |
silx.gui.widgets
| Source | Screenshot | Description |
|---|---|---|
periodicTable.py |
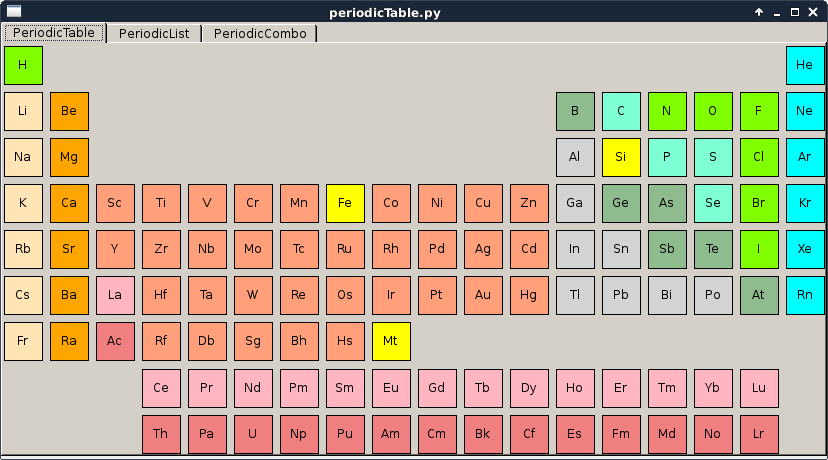
|
This script is a simple example of how to use the periodic table widgets, select elements and connect signals. |
simplewidget.py |
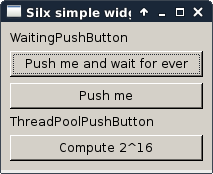
|
This script shows a gallery of simple widgets provided by silx. It shows the following widgets:
|
silx.gui.plot sample code
Widgets
| Source | Screenshot | Description |
|---|---|---|
imageview.py |
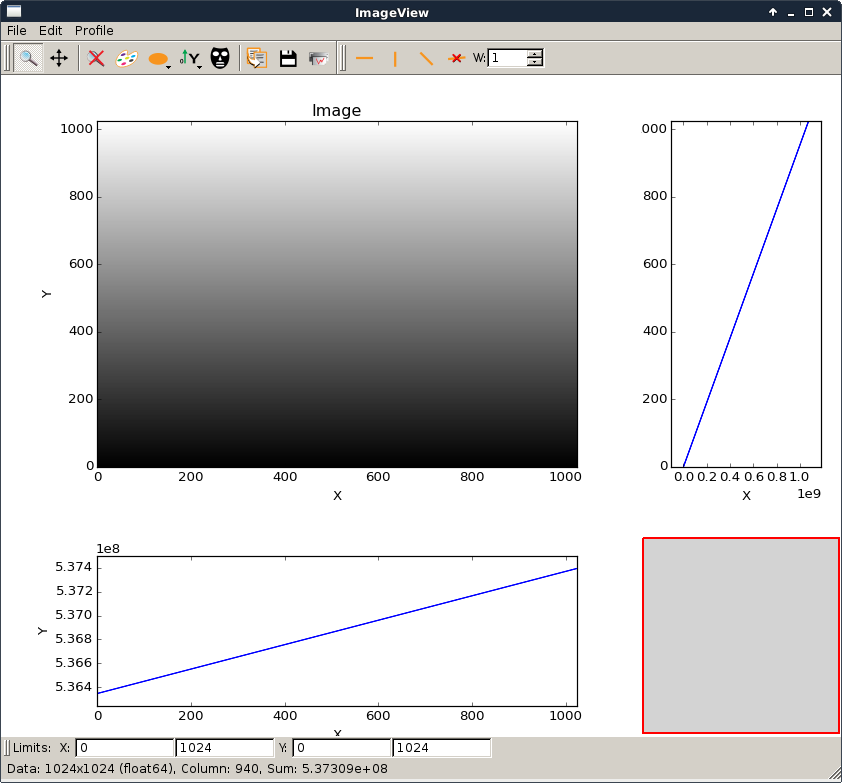
|
Example to show the use of It can be used to open an EDF or TIFF file from the shell command line. To view an image file with the current installed silx library:
For developers with a git clone you can use it with the bootstrap To view an image file with the current installed silx library:
|
stackView.py |
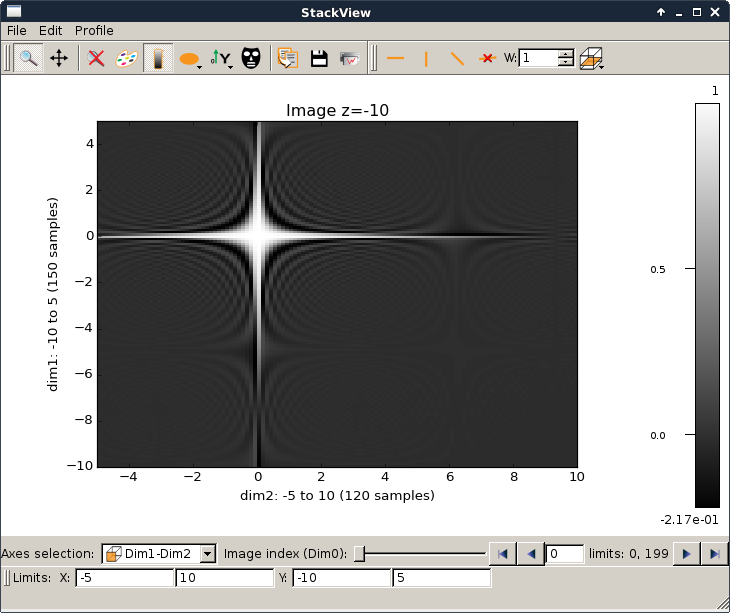
|
This script is a simple example to illustrate how to use the
StackView widget. |
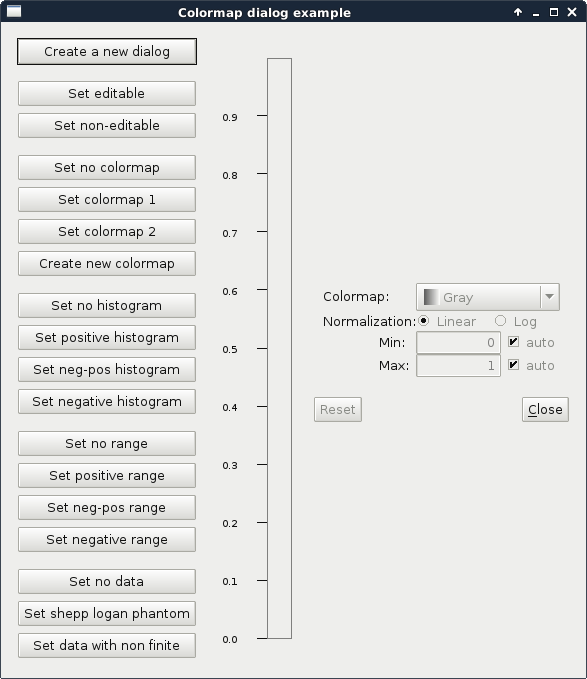
colormapDialog.py |
|
This script shows the features of a ColormapDialog. |
silx.gui.plot.actions.PlotAction
Sample code that adds buttons to the toolbar of a silx plot widget.
| Source | Screenshot | Description |
|---|---|---|
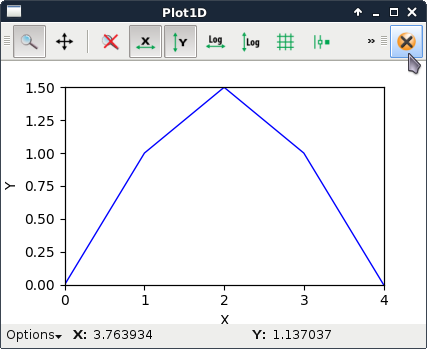
plotClearAction.py |
|
This script shows how to create a minimalistic
This illustrates how to add more buttons in a plot widget toolbar. |
shiftPlotAction.py |
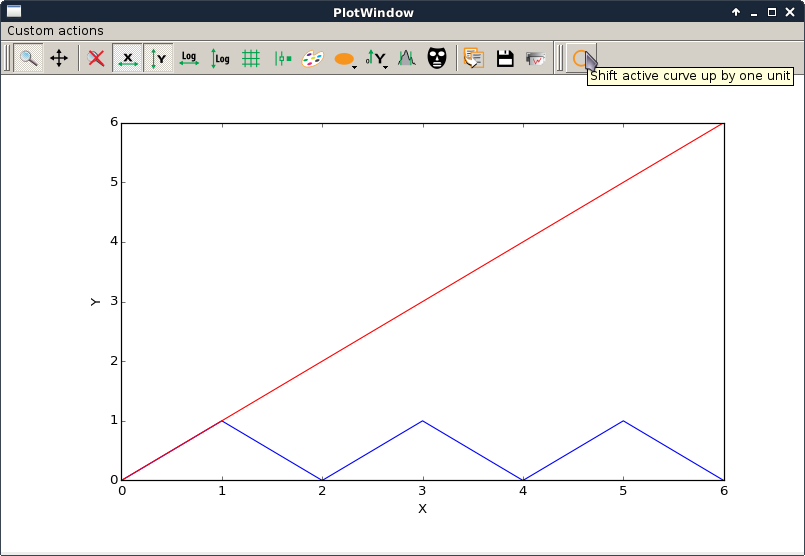
|
This script is a simple (trivial) example of how to create a The action simply shifts the selected curve up by 1 unit by adding 1 to each value of y. |
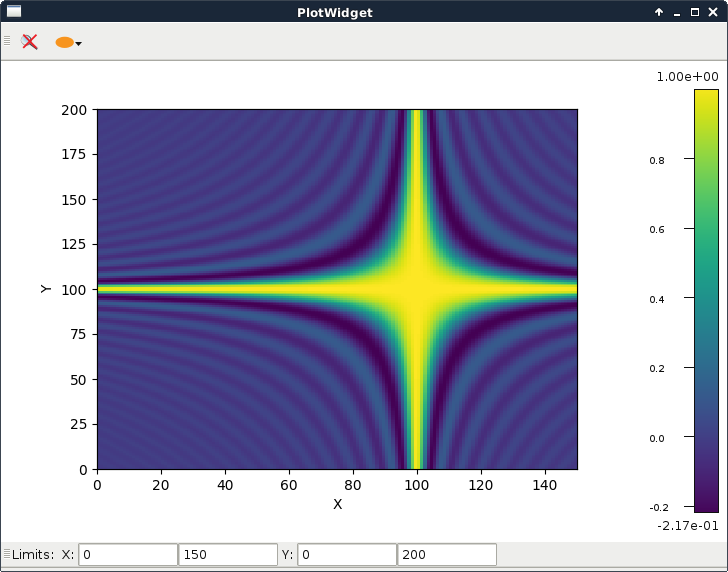
fftPlotAction.py,
fft.png |
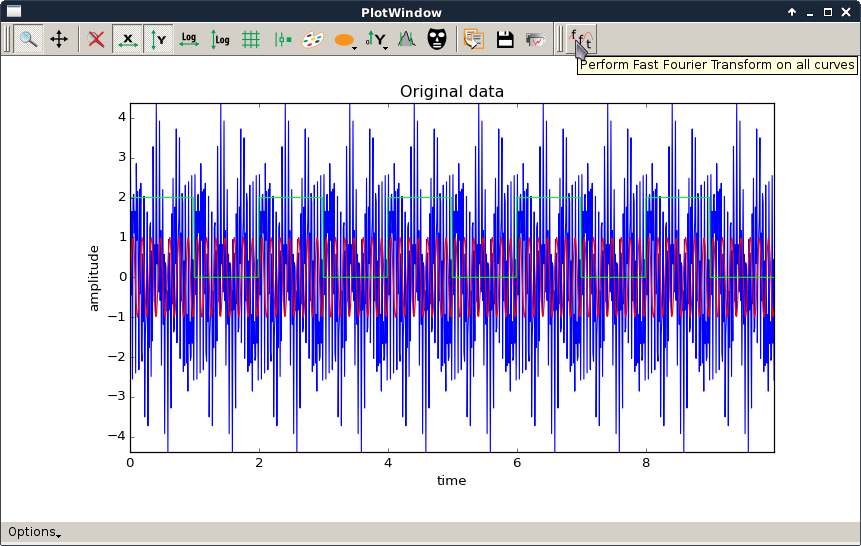
|
This script is a simple example of how to create a The action computes the FFT of all curves and plots their amplitude spectrum. It also performs the reverse transform.
See shiftPlotAction.py for a simpler example with more basic comments. |
Add features to PlotWidget
Sample code that adds specific tools or functions to plot widgets.
| Source | Screenshot | Description |
|---|---|---|
plotWidget.py |
|
This script shows how to subclass It subclasses a
|
plotContextMenu.py |
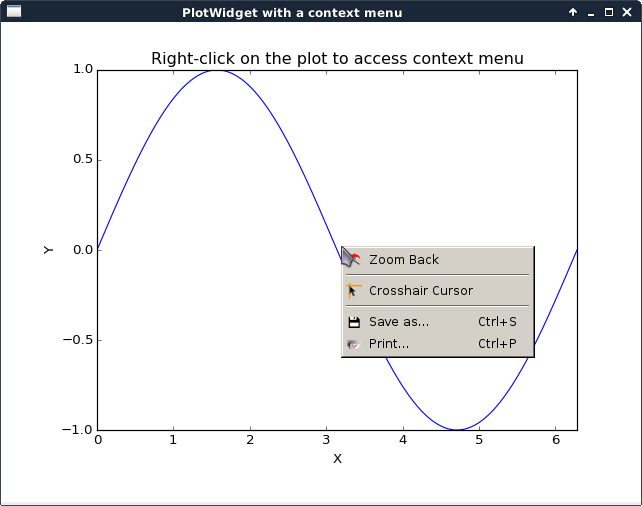
|
This script illustrates the addition of a context menu to a
This is done by adding a custom context menu to the plot area of PlotWidget: - set the context menu policy of the plot area to Qt.CustomContextMenu. - connect to the plot area customContextMenuRequested signal. The same method works with For more information on context menus, see Qt documentation. |
plotItemsSelector.py |
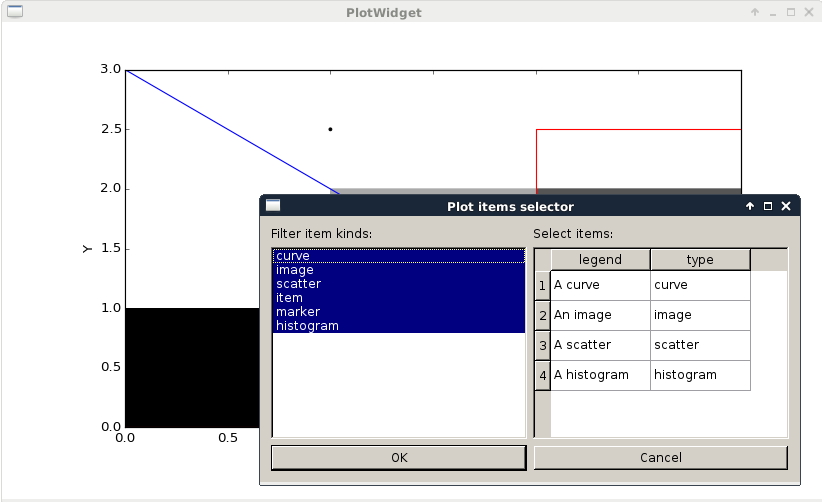
|
This example illustrates how to use a ItemsSelectionDialog widget
associated with a PlotWidget |
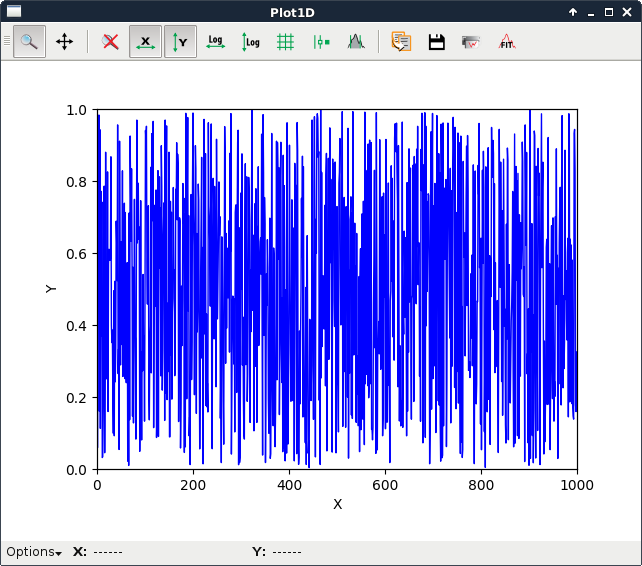
plotLimits.py |
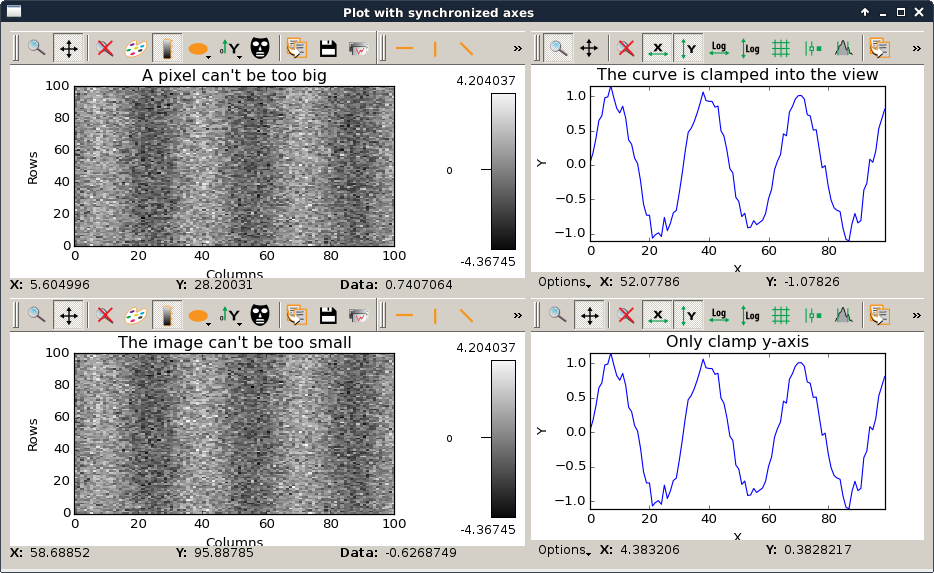
|
This script is an example to illustrate how to use axis synchronization tool. |
plotUpdateFromThread.py |
|
This script illustrates the update of a The problem is that plot and GUI methods should be called from the main thread. To safely update the plot from another thread, one need to make the update asynchronously from the main thread. In this example, this is achieved through a Qt signal. In this example we create a subclass of |
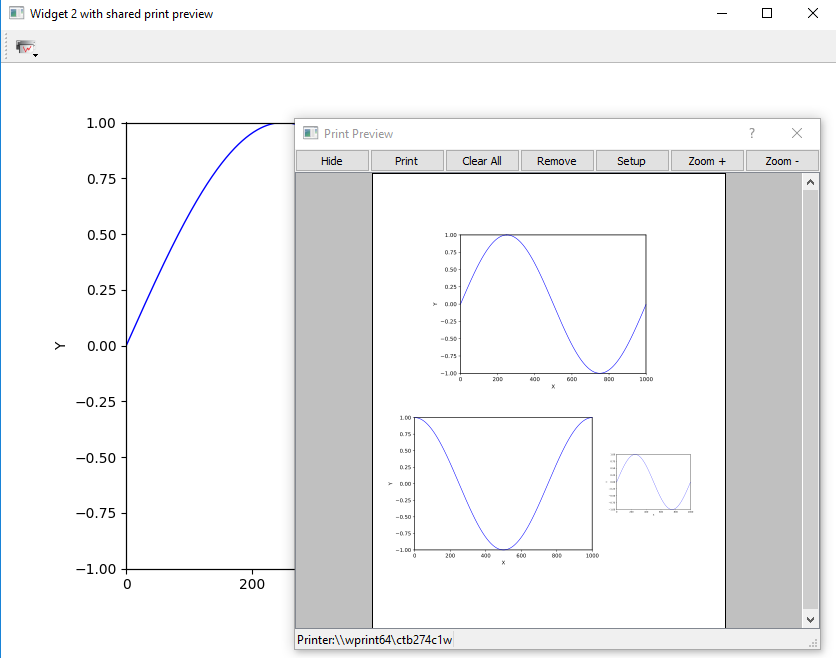
printPreview.py |
|
This script illustrates how to add a print preview tool button to any plot
widget inheriting Three plot widgets are instantiated. One of them uses a standalone
|
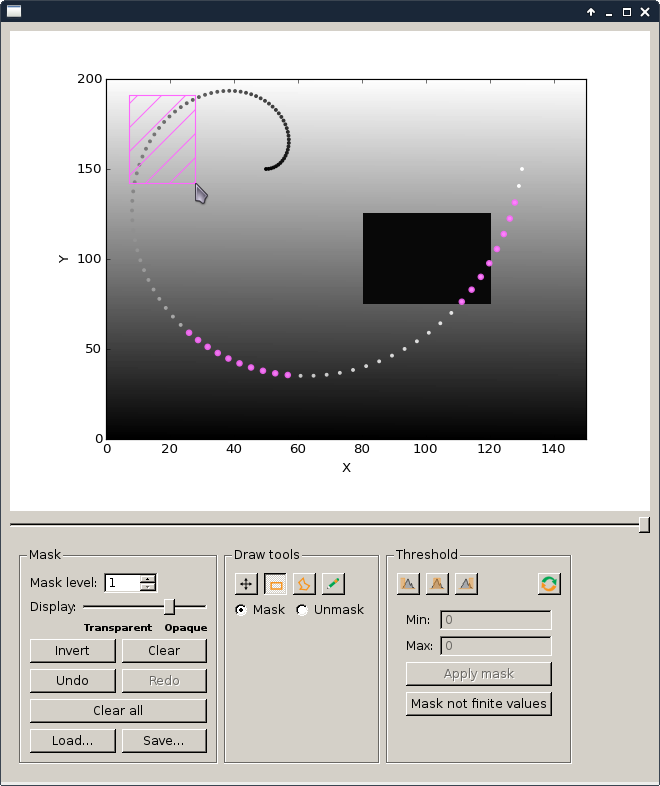
scatterMask.py |
|
This example demonstrates how to use ScatterMaskToolsWidget and NamedScatterAlphaSlider with a PlotWidget. |
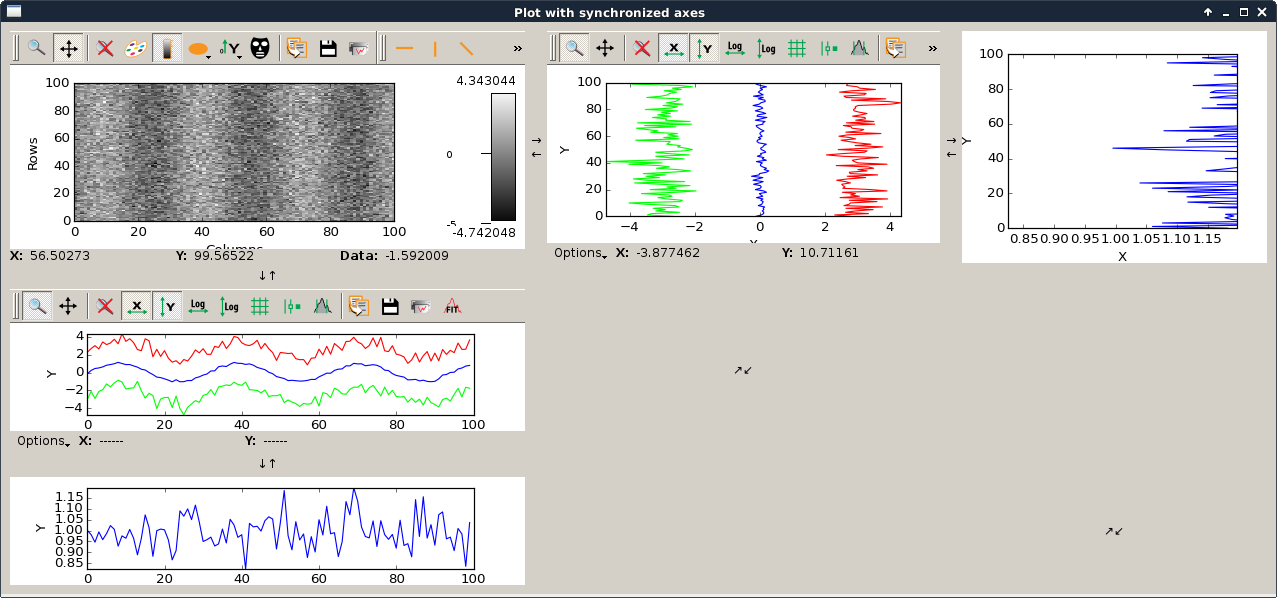
syncaxis.py |
|
This script is an example to illustrate how to use axis synchronization tool. |
silx.gui.plot3d sample code
| Source | Screenshot | Description |
|---|---|---|
plot3dContextMenu.py |
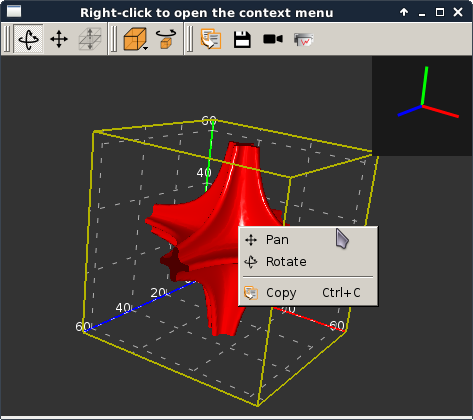
|
This script adds a context menu to a This is done by adding a custom context menu to the
For more information on context menus, see Qt documentation. |
viewer3DVolume.py |
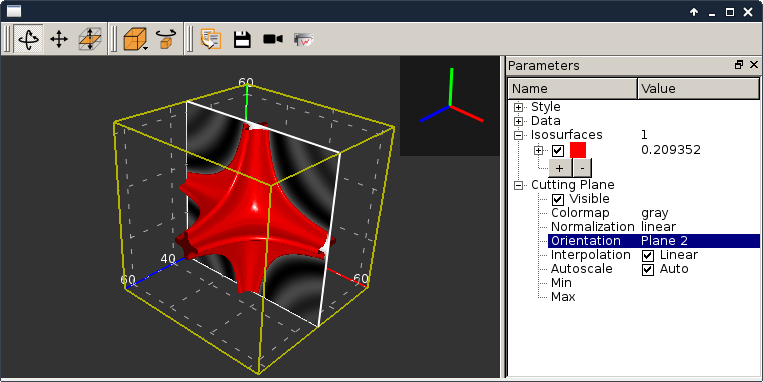
|
This script illustrates the use of It loads a 3D scalar data set from a file and displays iso-surfaces and an interactive cutting plane. It can also be started without providing a file. |
plot3dSceneWindow.py |
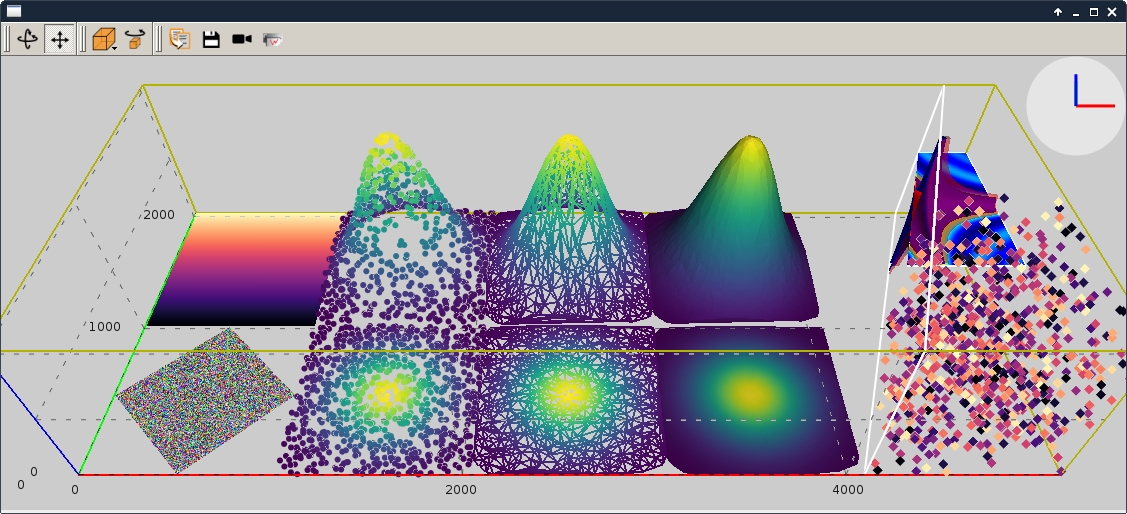
|
This script displays the different items of It shows the different visualizations of It features:
|
silx.io sample code
| Source | Screenshot | Description |
|---|---|---|
writetoh5.py |
This script is an example of how to use the silx.io.convert module.
See the following tutorial for more information: Converting various data files to HDF5 |
