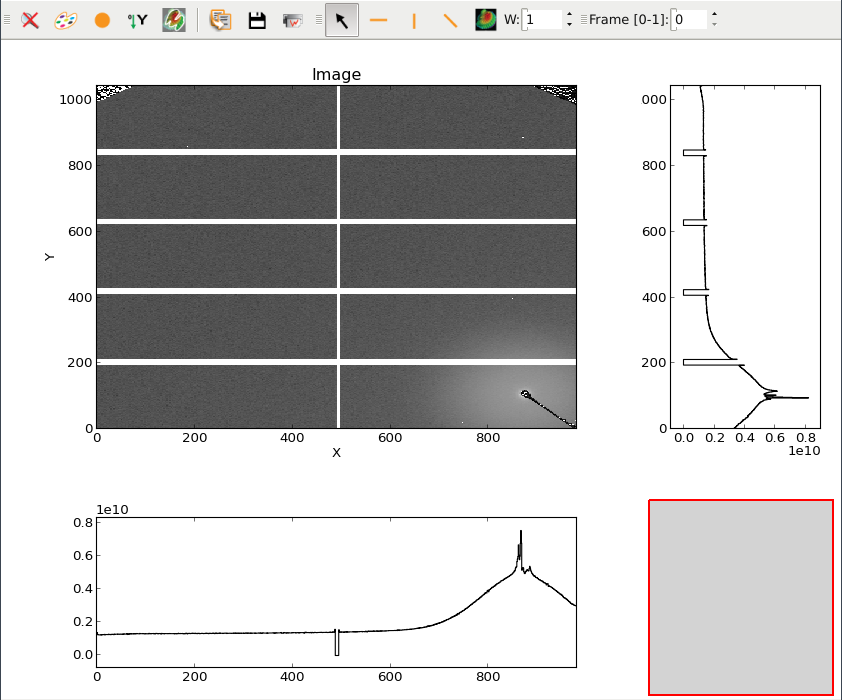
ImageView: Plot an image with side histograms
QWidget displaying a 2D image with histograms on its sides.
The ImageView implements this widget, and
ImageViewMainWindow provides a main window with additional toolbar
and status bar.
Basic usage of ImageView is through the following methods:
ImageView.getColormap(),ImageView.setColormap()to update the default colormap to use and update the currently displayed image.ImageView.setImage()to update the displayed image.
For an example of use, see imageview.py in Sample Code.
ImageView class
-
class
silx.gui.plot.ImageView.ImageView(parent=None, backend=None)[source]¶ Display a single image with horizontal and vertical histograms.
Use
setImage()to control the displayed image. This class also provides thesilx.gui.plot.PlotAPI.The
ImageViewinherits fromPlotWindow(which provides the toolbars) and also exposesPlotWidgetAPI for further plot control (plot title, axes labels, aspect ratio, ...).Parameters: - parent – The parent of this widget or None.
- backend (str or
BackendBase.BackendBase) – The backend to use for the plot (default: matplotlib). SeePlotWidgetfor the list of supported backend.
-
valueChanged¶ Signals that the data value under the cursor has changed.
It provides: row, column, data value.
When the cursor is over an histogram, either row or column is Nan and the provided data value is the histogram value (i.e., the sum along the corresponding row/column). Row and columns are either Nan or integer values.
-
getHistogram(axis)[source]¶ Return the histogram and corresponding row or column extent.
The returned value when an histogram is available is a dict with keys:
- ‘data’: numpy array of the histogram values.
- ‘extent’: (start, end) row or column index. end index is not included in the histogram.
Parameters: axis (str) – ‘x’ for horizontal, ‘y’ for vertical Returns: The histogram and its extent as a dict or None. Return type: dict
-
getColormap()[source]¶ Get the default colormap description.
Returns: A description of the current colormap. See setColormap()for details.Return type: dict
-
setColormap(colormap=None, normalization=None, autoscale=None, vmin=None, vmax=None, colors=None)[source]¶ Set the default colormap and update active image.
Parameters that are not provided are taken from the current colormap.
The colormap parameter can also be a dict with the following keys:
name: string. The colormap to use: ‘gray’, ‘reversed gray’, ‘temperature’, ‘red’, ‘green’, ‘blue’.
normalization: string. The mapping to use for the colormap: either ‘linear’ or ‘log’.
autoscale: bool. Whether to use autoscale (True) or range provided by keys ‘vmin’ and ‘vmax’ (False).
vmin: float. The minimum value of the range to use if ‘autoscale’ is False.
vmax: float. The maximum value of the range to use if ‘autoscale’ is False.
- colors: optional. Nx3 or Nx4 array of float in [0, 1] or uint8.
List of RGB or RGBA colors to use (only if name is None)
Parameters: - colormap (dict or str.) – Name of the colormap in ‘gray’, ‘reversed gray’, ‘temperature’, ‘red’, ‘green’, ‘blue’. Or the description of the colormap as a dict.
- normalization (str) – Colormap mapping: ‘linear’ or ‘log’.
- autoscale (bool) – Whether to use autoscale (True) or [vmin, vmax] range (False).
- vmin (float) – The minimum value of the range to use if ‘autoscale’ is False.
- vmax (float) – The maximum value of the range to use if ‘autoscale’ is False.
- colors (numpy.ndarray) – Only used if name is None. Custom colormap colors as Nx3 or Nx4 RGB or RGBA arrays
-
setImage(image, origin=(0, 0), scale=(1.0, 1.0), copy=True, reset=True)[source]¶ Set the image to display.
Parameters: - image (numpy.ndarray-like with 2 dimensions or None.) – A 2D array representing the image or None to empty plot.
- origin (Tuple of 2 floats: (origin x, origin y).) – The (x, y) position of the origin of the image. Default: (0, 0). The origin is the lower left corner of the image when the Y axis is not inverted.
- scale (Tuple of 2 floats: (scale x, scale y).) – The scale factor to apply to the image on X and Y axes. Default: (1, 1). It is the size of a pixel in the coordinates of the axes. Scales must be positive numbers.
- copy (bool) – Whether to copy image data (default) or not.
- reset (bool) – Whether to reset zoom and ROI (default) or not.
-
getXAxis()¶ Returns the X axis
New in version 0.6.
Return type: items.Axis
-
getYAxis(axis='left')¶ Returns an Y axis
New in version 0.6.
Parameters: axis (str) – The Y axis to return (‘left’ or ‘right’). Return type: items.Axis
-
setGraphTitle(title='')¶ Set the plot main title.
Parameters: title (str) – Main title of the plot (default: ‘’)