PlotTools: Tool widgets for PlotWidget
Set of widgets to associate with a :class:’PlotWidget’.
PositionInfo class
-
class
silx.gui.plot.PlotTools.PositionInfo(parent=None, plot=None, converters=None)[source]¶ Bases:
PyQt4.QtGui.QWidgetQWidget displaying coords converted from data coords of the mouse.
Provide this widget with a list of couple:
- A name to display before the data
- A function that takes (x, y) as arguments and returns something that gets converted to a string. If the result is a float it is converted with ‘%.7g’ format.
To run the following sample code, a QApplication must be initialized. First, create a PlotWindow and add a QToolBar where to place the PositionInfo widget.
>>> from silx.gui.plot import PlotWindow
>>> from silx.gui import qt
>>> plot = PlotWindow()  # Create a PlotWindow to add the widget to
>>> toolBar = qt.QToolBar()  # Create a toolbar to place the widget in
>>> plot.addToolBar(qt.Qt.BottomToolBarArea, toolBar)  # Add it to plot
Then, create the PositionInfo widget and add it to the toolbar. The PositionInfo widget is created with a list of converters, here to display polar coordinates of the mouse position.
>>> import numpy
>>> from silx.gui.plot.PlotTools import PositionInfo
>>> position = PositionInfo(plot=plot, converters=[
...     ('Radius', lambda x, y: numpy.sqrt(x*x + y*y)),
...     ('Angle', lambda x, y: numpy.degrees(numpy.arctan2(y, x)))])
>>> toolBar.addWidget(position)  # Add the widget to the toolbar
<...>
>>> plot.show()  # To display the PlotWindow with the position widget
Parameters: - plot – The PlotWidget this widget is displaying data coords from.
- converters – List of 2-tuple: name to display and conversion function from (x, y) in data coords to displayed value. If None, the default, it displays X and Y.
- parent – Parent widget
-
autoSnapToActiveCurve= None¶ Toggle snapping use position to active curve.
- True to snap used coordinates to the active curve if the active curve is displayed with symbols and mouse is close enough. If the mouse is not close to a point of the curve, values are displayed in red.
- False (the default) to always use mouse coordinates.
-
plot¶ The
PlotWindowthis widget is attached to.
LimitsToolBar class
-
class
silx.gui.plot.PlotTools.LimitsToolBar(parent=None, plot=None, title='Limits')[source]¶ Bases:
PyQt4.QtGui.QToolBarQToolBar displaying and controlling the limits of a
PlotWidget.To run the following sample code, a QApplication must be initialized. First, create a PlotWindow:
>>> from silx.gui.plot import PlotWindow
>>> plot = PlotWindow()  # Create a PlotWindow to add the toolbar to
Then, create the LimitsToolBar and add it to the PlotWindow.
>>> from silx.gui import qt
>>> from silx.gui.plot.PlotTools import LimitsToolBar
>>> toolbar = LimitsToolBar(plot=plot)  # Create the toolbar
>>> plot.addToolBar(qt.Qt.BottomToolBarArea, toolbar)  # Add it to the plot
>>> plot.show()  # To display the PlotWindow with the limits toolbar
Parameters: - parent – See
QToolBar. - plot –
PlotWidgetinstance on which to operate. - title (str) – See
QToolBar.
-
plot¶ The
PlotWidgetthe toolbar is attached to.
- parent – See
ColorBar: ColorBar Widget
Module containing several widgets associated to a colormap.
ColorBarWidget class
-
class
silx.gui.plot.ColorBar.ColorBarWidget(parent=None, plot=None, legend=None)[source]¶ Colorbar widget displaying a colormap
It uses a description of colormap as dict compatible with
Plot.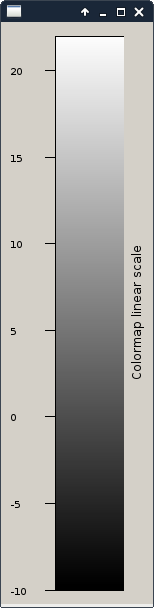
To run the following sample code, a QApplication must be initialized.
>>> from silx.gui.plot import Plot2D
>>> from silx.gui.plot.ColorBar import ColorBarWidget
>>> plot = Plot2D()  # Create a plot widget
>>> plot.show()
>>> colorbar = ColorBarWidget(plot=plot, legend='Colormap')  # Associate the colorbar with it
>>> colorbar.show()
Initializer parameters:
Parameters: - parent – See
QWidget - plot – PlotWidget the colorbar is attached to (optional)
- legend (str) – the label to set to the colorbar
-
sigVisibleChanged¶ Emitted when the property visible have changed.
-
setPlot(plot)[source]¶ Associate a plot to the ColorBar
Parameters: plot – the plot to associate with the colorbar. If None will remove any connection with a previous plot.
-
setColormap(colormap, data=None)[source]¶ Set the colormap to be displayed.
Parameters: - colormap (
Colormap) – The colormap to apply on the ColorBarWidget - data (numpy.ndarray) – the data to display, needed if the colormap require an autoscale
- colormap (
-
setLegend(legend)[source]¶ Set the legend displayed along the colorbar
Parameters: legend (str) – The label
- parent – See