Package structure
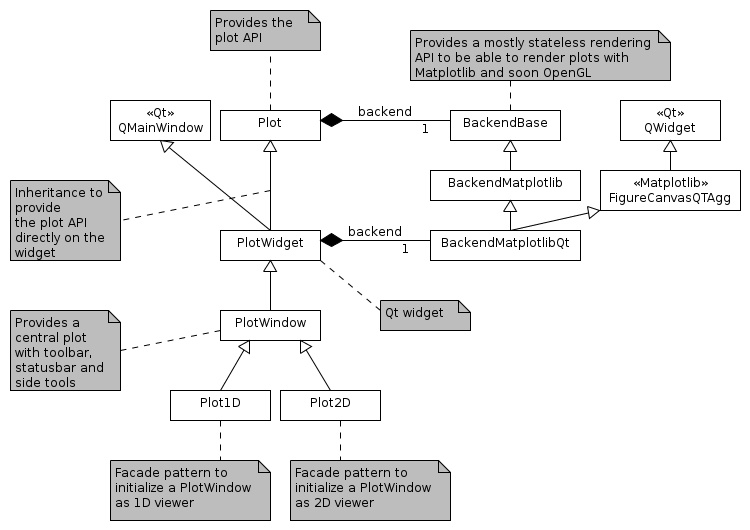
The silx.gui.plot package provides plot widgets. This package is structured as follows.
PlotWidget and PlotWindow provides the user API. PlotWidget is a Qt widget (actually a QMainWindow) displaying a 1D, 2D plot area. It provides different interaction modes. PlotWindow is a Qt widget (actually a QMainWindow) which adds a set of toolbar buttons and associated functionalities to PlotWidget. The toolbar QActions are implemented in PlotActions.
Plot, PlotEvents and PlotInteraction implement the plotting API regardless of the rendering backend and regardless of its integration in Qt. The plotting API in defined in Plot. The different interaction modes (zoom, drawing, pan) are implemented in PlotInteraction. Each interaction mode is implemented with a state machine structure (implemented in Interaction). The different events emitted by Plot and by the interaction modes are created with helper functions defined in PlotEvents.
The PlotWindow uses additional widgets:
- ColormapDialog to change colormap settings.
- CurvesROIWidget to create regions of interest for curves
- LegendSelector to display a list of curves legends which provides some control on the curves (e.g., select, delete).
- MaskToolsWidget to provide tools to draw a mask on an image.
- The PlotTools module provides a set of additional widgets:
- The Profile module provides toolbar for extracting profiles from image and image stack:
- silx.gui.console to provide an IPython console which can control the plot area content.
The widgets also use the following miscellaneous modules:
- Colors to convert colors from name to RGB(A)
- ModestImage to provide a faster matplotlib AxesImage class using nearest values.
- MPLColormap to embed recent matplotlib colormaps: ‘magma’, ‘inferno’, ‘plasma’ and ‘viridis’.
- _utils: utility functions
BackendBase defines the API any plot backend should provide in BackendBase. BackendMatplotlib implements a matplotlib backend. It is splitted in two classes:
- BackendMatplotlib that provides a matplotlib backend without a specific canvas.
- BackendMatplotlibQt which inherits from BackendMatplotlib and adds a Qt canvas, and Qt specific functionalities.
Modules
For PlotWidget and Plot modules, see their respective documentations: PlotWidget, Plot.
The following modules are the modules used internally by the plot package.
BackendBase
Base class for Plot backends.
It documents the Plot backend API.
This API is a simplified version of PyMca PlotBackend API.
- class silx.gui.plot.BackendBase.BackendBase(plot, parent=None)[source]
Class defining the API a backend of the Plot should provide.
- addCurve(x, y, legend, color, symbol, linewidth, linestyle, yaxis, xerror, yerror, z, selectable, fill)[source]
Add a 1D curve given by x an y to the graph.
Parameters: - x (numpy.ndarray) – The data corresponding to the x axis
- y (numpy.ndarray) – The data corresponding to the y axis
- legend (str) – The legend to be associated to the curve
- color (string (“#RRGGBB”) or (npoints, 4) unsigned byte array or one of the predefined color names defined in Colors.py) – color(s) to be used
- symbol (str) –
Symbol to be drawn at each (x, y) position:
- ' ' or '' no symbol
- 'o' circle
- '.' point
- ',' pixel
- '+' cross
- 'x' x-cross
- 'd' diamond
- 's' square
- linewidth (float) –
The width of the curve in pixels
- ‘ ‘ or ‘’ no line
- ‘-‘ solid line
- ‘–’ dashed line
- ‘-.’ dash-dot line
- ‘:’ dotted line
- yaxis (str) – The Y axis this curve belongs to in: ‘left’, ‘right’
- xerror (numpy.ndarray or None) – Values with the uncertainties on the x values
- yerror (numpy.ndarray or None) – Values with the uncertainties on the y values
- z (int) – Layer on which to draw the cuve
- selectable (bool) – indicate if the curve can be selected
Returns: The handle used by the backend to univocally access the curve
- addImage(data, legend, origin, scale, z, selectable, draggable, colormap)[source]
Add an image to the plot.
Parameters: - data (numpy.ndarray) – (nrows, ncolumns) data or (nrows, ncolumns, RGBA) ubyte array
- legend (str) – The legend to be associated to the image
- origin (2-tuple of float) – (origin X, origin Y) of the data. Default: (0., 0.)
- scale (2-tuple of float) – (scale X, scale Y) of the data. Default: (1., 1.)
- z (int) – Layer on which to draw the image
- selectable (bool) – indicate if the image can be selected
- draggable (bool) – indicate if the image can be moved
- colormap (dict or None) – Dictionary describing the colormap to use. Ignored if data is RGB(A).
Returns: The handle used by the backend to univocally access the image
- addItem(x, y, legend, shape, color, fill, overlay, z)[source]
Add an item (i.e. a shape) to the plot.
Parameters: - x (numpy.ndarray) – The X coords of the points of the shape
- y (numpy.ndarray) – The Y coords of the points of the shape
- legend (str) – The legend to be associated to the item
- shape (str) – Type of item to be drawn in hline, polygon, rectangle, vline, polylines
- fill (bool) – True to fill the shape
- overlay (bool) – True if item is an overlay, False otherwise
- z (int) – Layer on which to draw the item
Returns: The handle used by the backend to univocally access the item
- addMarker(x, y, legend, text, color, selectable, draggable, symbol, constraint, overlay)[source]
Add a point, vertical line or horizontal line marker to the plot.
Parameters: - x (float) – Horizontal position of the marker in graph coordinates. If None, the marker is a horizontal line.
- y (float) – Vertical position of the marker in graph coordinates. If None, the marker is a vertical line.
- legend (str) – Legend associated to the marker
- text (str) – Text associated to the marker (or None for no text)
- color (str) – Color to be used for instance ‘blue’, ‘b’, ‘#FF0000’
- selectable (bool) – indicate if the marker can be selected
- draggable (bool) – indicate if the marker can be moved
- symbol (str) –
Symbol representing the marker. Only relevant for point markers where X and Y are not None. Value in:
- ‘o’ circle
- ‘.’ point
- ‘,’ pixel
- ‘+’ cross
- ‘x’ x-cross
- ‘d’ diamond
- ‘s’ square
- constraint (None or a callable that takes the coordinates of the current cursor position in the plot as input and that returns the filtered coordinates.) – A function filtering marker displacement by dragging operations or None for no filter. This function is called each time a marker is moved. This parameter is only used if draggable is True.
- overlay (bool) – True if marker is an overlay (Default: False). This allows for rendering optimization if this marker is changed often.
Returns: Handle used by the backend to univocally access the marker
- remove(item)[source]
Remove an existing item from the plot.
Parameters: item – A backend specific item handle returned by a add* method
- setGraphCursorShape(cursor)[source]
Set the cursor shape.
To override in interactive backends.
Parameters: cursor (str) – Name of the cursor shape or None
- setGraphCursor(flag, color, linewidth, linestyle)[source]
Toggle the display of a crosshair cursor and set its attributes.
To override in interactive backends.
Parameters: - flag (bool) – Toggle the display of a crosshair cursor.
- color (A string (either a predefined color name in Colors.py or “#RRGGBB”)) or a 4 columns unsigned byte array.) – The color to use for the crosshair.
- linewidth (int) – The width of the lines of the crosshair.
- linestyle (None or one of the predefined styles.) –
Type of line:
- ' ' no line
- '-' solid line
- '--' dashed line
- '-.' dash-dot line
- ':' dotted line
- pickItems(x, y)[source]
Get a list of items at a pixel position.
Parameters: - x (float) – The x pixel coord where to pick.
- y (float) – The y pixel coord where to pick.
Returns: All picked items from back to front. One dict per item, with ‘kind’ key in ‘curve’, ‘marker’, ‘image’; ‘legend’ key, the item legend. and for curves, ‘xdata’ and ‘ydata’ keys storing picked position on the curve.
Return type: list of dict
- setActiveCurve(curve, active, color=None)[source]
Set/Reset the color of a curve to show that it is active.
Parameters: - curve – The curve handle
- active (bool) – True to set curve to color, False to reset curve to its initial color.
- color (str) – The color to use.
- postRedisplay()[source]
Trigger a Plot.replot().
Default implementation triggers a synchronous replot if plot is dirty. This method should be overridden by the embedding widget in order to provide an asynchronous call to replot in order to optimize the number replot operations.
- saveGraph(fileName, fileFormat, dpi)[source]
Save the graph to a file (or a StringIO)
Parameters: - fileName (String or StringIO or BytesIO) – Destination
- fileFormat (str) – String specifying the format
- dpi (int) – The resolution to use or None.
- setGraphTitle(title)[source]
Set the main title of the plot.
Parameters: title (str) – Title associated to the plot
- setGraphXLabel(label)[source]
Set the X axis label.
Parameters: label (str) – label associated to the plot bottom X axis
- setGraphYLabel(label, axis)[source]
Set the left Y axis label.
Parameters: - label (str) – label associated to the plot left Y axis
- axis (str) – The axis for which to get the limits: left or right
- resetZoom(dataMargins)[source]
Reset the displayed area of the plot.
Autoscale any axis that is in autoscale mode. Keep current limits on axes not in autoscale mode
Extra margins can be added around the data inside the plot area. Margins are given as one ratio of the data range per limit of the data (xMin, xMax, yMin and yMax limits). For log scale, extra margins are applied in log10 of the data.
Parameters: dataMargins (A 4-tuple of float as (xMin, xMax, yMin, yMax).) – Ratios of margins to add around the data inside the plot area for each side
- setLimits(xmin, xmax, ymin, ymax, y2min=None, y2max=None)[source]
Set the limits of the X and Y axes at once.
Parameters: - xmin (float) – minimum bottom axis value
- xmax (float) – maximum bottom axis value
- ymin (float) – minimum left axis value
- ymax (float) – maximum left axis value
- y2min (float) – minimum right axis value
- y2max (float) – maximum right axis value
- getGraphXLimits()[source]
Get the graph X (bottom) limits.
Returns: Minimum and maximum values of the X axis
- setGraphXLimits(xmin, xmax)[source]
Set the limits of X axis.
Parameters: - xmin (float) – minimum bottom axis value
- xmax (float) – maximum bottom axis value
- getGraphYLimits(axis)[source]
Get the graph Y (left) limits.
Parameters: axis (str) – The axis for which to get the limits: left or right Returns: Minimum and maximum values of the Y axis
- setGraphYLimits(ymin, ymax, axis)[source]
Set the limits of the Y axis.
Parameters: - ymin (float) – minimum left axis value
- ymax (float) – maximum left axis value
- axis (str) – The axis for which to get the limits: left or right
- setXAxisLogarithmic(flag)[source]
Set the X axis scale between linear and log.
Parameters: flag (bool) – If True, the bottom axis will use a log scale
- setYAxisLogarithmic(flag)[source]
Set the Y axis scale between linear and log.
Parameters: flag (bool) – If True, the left axis will use a log scale
- setYAxisInverted(flag)[source]
Invert the Y axis.
Parameters: flag (bool) – If True, put the vertical axis origin on the top
- setKeepDataAspectRatio(flag)[source]
Set whether to keep data aspect ratio or not.
Parameters: flag (Boolean, default True) – True to respect data aspect ratio
- setGraphGrid(which)[source]
Set grid.
Parameters: which – None to disable grid, ‘major’ for major grid, ‘both’ for major and minor grid
- getSupportedColormaps()[source]
Get a list of strings with the supported colormap names.
The list should at least contain and start by: [‘gray’, ‘reversed gray’, ‘temperature’, ‘red’, ‘green’, ‘blue’]
- dataToPixel(x, y, axis)[source]
Convert a position in data space to a position in pixels in the widget.
Parameters: - x (float) – The X coordinate in data space.
- y (float) – The Y coordinate in data space.
- axis (str) – The Y axis to use for the conversion (‘left’ or ‘right’).
Returns: The corresponding position in pixels or None if the data position is not in the displayed area.
Return type: A tuple of 2 floats: (xPixel, yPixel) or None.
- pixelToData(x, y, axis, check)[source]
Convert a position in pixels in the widget to a position in the data space.
Parameters: - x (float) – The X coordinate in pixels.
- y (float) – The Y coordinate in pixels.
- axis (str) – The Y axis to use for the conversion (‘left’ or ‘right’).
- check (bool) – True to check if the coordinates are in the plot area.
Returns: The corresponding position in data space or None if the pixel position is not in the plot area.
Return type: A tuple of 2 floats: (xData, yData) or None.
BackendMatplotlib
Matplotlib Plot backend.
- class silx.gui.plot.BackendMatplotlib.BackendMatplotlib(plot, parent=None)[source]
Base class for Matplotlib backend without a FigureCanvas.
For interactive on screen plot, see BackendMatplotlibQt.
See BackendBase.BackendBase for public API documentation.
ColormapDialog
A QDialog widget to set-up the colormap.
It uses a description of colormaps as dict compatible with Plot.
To run the following sample code, a QApplication must be initialized.
Create the colormap dialog and set the colormap description and data range:
>>> from silx.gui.plot.ColormapDialog import ColormapDialog
>>> dialog = ColormapDialog()
>>> dialog.setColormap(name='red', normalization='log',
...                    autoscale=False, vmin=1., vmax=2.)
>>> dialog.setDataRange(1., 100.)  # This scale the width of the plot area
>>> dialog.show()
Get the colormap description (compatible with Plot) from the dialog:
>>> cmap = dialog.getColormap()
>>> cmap['name']
'red'
It is also possible to display an histogram of the image in the dialog. This updates the data range with the range of the bins.
>>> import numpy
>>> image = numpy.random.normal(size=512 * 512).reshape(512, -1)
>>> hist, bin_edges = numpy.histogram(image, bins=10)
>>> dialog.setHistogram(hist, bin_edges)
The updates of the colormap description are also available through the signal: ColormapDialog.sigColormapChanged.
- class silx.gui.plot.ColormapDialog.ColormapDialog(parent=None, title='Colormap Dialog')[source]
A QDialog widget to set the colormap.
Parameters: - parent – See QDialog
- title (str) – The QDialog title
- sigColormapChanged
Signal triggered when the colormap is changed.
It provides a dict describing the colormap to the slot. This dict can be used with Plot.
- getHistogram()[source]
Returns the counts and bin edges of the displayed histogram.
Returns: (hist, bin_edges) Return type: 2-tuple of numpy arrays
- setHistogram(hist=None, bin_edges=None)[source]
Set the histogram to display.
This update the data range with the bounds of the bins. See setDataRange().
Parameters: - hist – array-like of counts or None to hide histogram
- bin_edges – array-like of bins edges or None to hide histogram
- getDataRange()[source]
Returns the data range used for the histogram area.
Returns: (dataMin, dataMax) or None if no data range is set Return type: 2-tuple of float
- setDataRange(min_=None, max_=None)[source]
Set the range of data to use for the range of the histogram area.
Parameters: - min (float) – The min of the data or None to disable range.
- max (float) – The max of the data or None to disable range.
- getColormap()[source]
Return the colormap description as a dict.
See Plot for documentation on the colormap dict.
- setColormap(name=None, normalization=None, autoscale=None, vmin=None, vmax=None, colors=None)[source]
Set the colormap description
If some arguments are not provided, the current values are used.
Parameters: - name (str) – The name of the colormap
- normalization (str) – ‘linear’ or ‘log’
- autoscale (bool) – Toggle colormap range autoscale
- vmin (float) – The min value, ignored if autoscale is True
- vmax (float) – The max value, ignored if autoscale is True
Colors
Color conversion function, color dictionary and colormap tools.
- silx.gui.plot.Colors.rgba(color, colorDict=None)[source]
Convert color code ‘#RRGGBB’ and ‘#RRGGBBAA’ to (R, G, B, A)
It also convert RGB(A) values from uint8 to float in [0, 1] and accept a QColor as color argument.
Parameters: - color (str) – The color to convert
- colorDict (dict) – A dictionary of color name conversion to color code
Returns: RGBA colors as floats in [0., 1.]
Return type: tuple
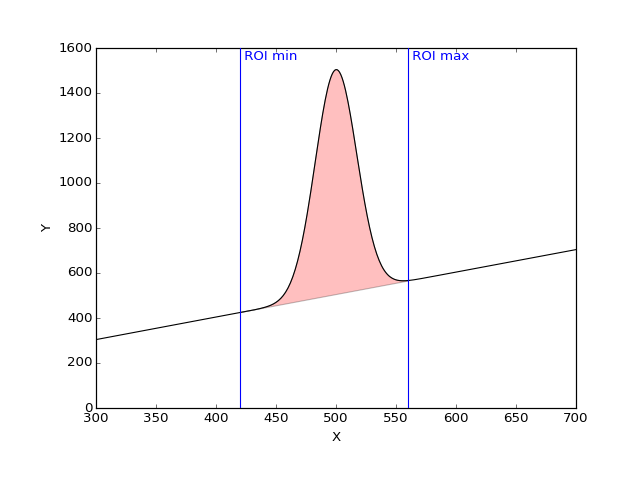
CurvesROIWidget
Widget to handle regions of interest (ROI) on curves displayed in a PlotWindow.
This widget is meant to work with PlotWindow.
ROI are defined by :
A name (ROI column)
A type. The type is the label of the x axis. This can be used to apply or not some ROI to a curve and do some post processing.
The x coordinate of the left limit (from column)
The x coordinate of the right limit (to column)
Raw counts: integral of the curve between the min ROI point and the max ROI point to the y = 0 line
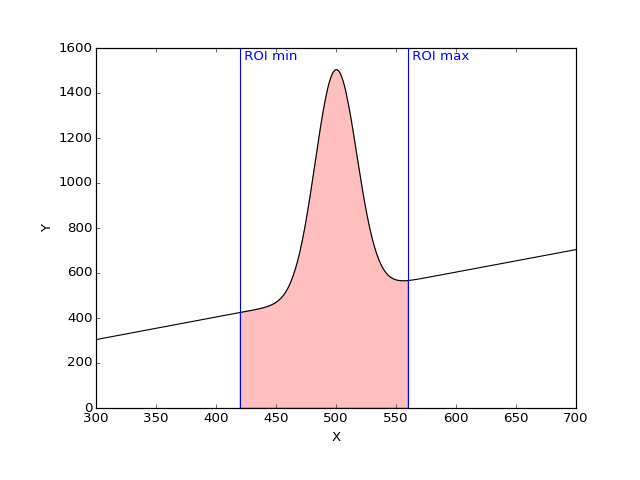
Net counts: the integral of the curve between the min ROI point and the max ROI point to [ROI min point, ROI max point] segment
- class silx.gui.plot.CurvesROIWidget.CurvesROIWidget(parent=None, name=None)[source]
Widget displaying a table of ROI information.
Parameters: - parent – See QWidget
- name (str) – The title of this widget
- sigROIWidgetSignal
Signal of ROIs modifications.
Modification information if given as a dict with an ‘event’ key providing the type of events.
Type of events:
- AddROI, DelROI, LoadROI and ResetROI with keys: ‘roilist’, ‘roidict’
- selectionChanged with keys: ‘row’, ‘col’ ‘roi’, ‘key’, ‘colheader’, ‘rowheader’
- load(filename)[source]
Load ROI widget information from a file storing a dict of ROI.
Parameters: filename (str) – The file from which to load ROI
- class silx.gui.plot.CurvesROIWidget.ROITable(*args, **kwargs)[source]
Table widget displaying ROI information.
See QTableWidget for constructor arguments.
- sigROITableSignal
Signal of ROI table modifications.
- class silx.gui.plot.CurvesROIWidget.CurvesROIDockWidget(parent=None, plot=None, name=None)[source]
QDockWidget with a CurvesROIWidget connected to a PlotWindow.
It makes the link between the CurvesROIWidget and the PlotWindow.
Parameters: - parent – See QDockWidget
- plot – PlotWindow instance on which to operate
- name – See QDockWidget
Interaction
This module provides an implementation of state machines for interaction.
Sample code of a state machine with two states (‘idle’ and ‘active’) with transitions on left button press/release:
from silx.gui.plot.Interaction import *

class SampleStateMachine(StateMachine):

    class Idle(State):
        def onPress(self, x, y, btn):
            if btn == LEFT_BTN:
                self.goto('active')

    class Active(State):
        def enterState(self):
            print('Enabled')  # Handle enter active state here

        def leaveState(self):
            print('Disabled')  # Handle leave active state here

        def onRelease(self, x, y, btn):
            if btn == LEFT_BTN:
                self.goto('idle')

def __init__(self):
    # State machine has 2 states
    states = {
        'idle': SampleStateMachine.Idle,
        'active': SampleStateMachine.Active
    }
    super(TwoStates, self).__init__(states, 'idle')
    # idle is the initial state

stateMachine = SampleStateMachine()

# Triggers a transition to the Active state:
stateMachine.handleEvent('press', 0, 0, LEFT_BTN)

# Triggers a transition to the Idle state:
stateMachine.handleEvent('release', 0, 0, LEFT_BTN)
See ClickOrDrag for another example of a state machine.
See Renaud Blanch, Michel Beaudouin-Lafon. Programming Rich Interactions using the Hierarchical State Machine Toolkit. In Proceedings of AVI 2006. p 51-58. for a discussion of using (hierarchical) state machines for interaction.
- class silx.gui.plot.Interaction.State(machine)[source]
Base class for the states of a state machine.
This class is meant to be subclassed.
- machine[source]
The state machine this state belongs to.
Useful to access data or methods that are shared across states.
- goto(state, *args, **kwargs)[source]
Performs a transition to a new state.
Extra arguments are passed to the enterState() method of the new state.
Parameters: state (str) – The name of the state to go to.
- class silx.gui.plot.Interaction.StateMachine(states, initState, *args, **kwargs)[source]
State machine controller.
This is the entry point of a state machine. It is in charge of dispatching received event and handling the current active state.
- handleEvent(eventName, *args, **kwargs)[source]
Process an event with the state machine.
This method looks up for an event handler in the current state and then in the StateMachine instance. Handler are looked up as ‘onEventName’ method. If a handler is found, it is called with the provided extra arguments, and this method returns the return value of the handler. If no handler is found, this method returns None.
Parameters: eventName (str) – Name of the event to handle Returns: The return value of the handler or None
- silx.gui.plot.Interaction.LEFT_BTN = 'left'
Left mouse button.
- silx.gui.plot.Interaction.RIGHT_BTN = 'right'
Right mouse button.
- silx.gui.plot.Interaction.MIDDLE_BTN = 'middle'
Middle mouse button.
- class silx.gui.plot.Interaction.ClickOrDrag[source]
State machine for left and right click and left drag interaction.
It is intended to be used through subclassing by overriding click(), beginDrag(), drag() and endDrag().
LegendSelector
Widget displaying curves legends and allowing to operate on curves.
This widget is meant to work with PlotWindow.
- silx.gui.plot.LegendSelector.NoSymbols = (None, 'None', 'none', '', ' ')
List of values resulting in no symbol being displayed for a curve
- silx.gui.plot.LegendSelector.LineStyles = {'': 0, ' ': 0, 'None': 0, '-.': 4, '--': 2, ':': 3, '-': 1, 'none': 0, None: 0}
Conversion from matplotlib-like linestyle to Qt
- silx.gui.plot.LegendSelector.NoLineStyle = (None, 'None', 'none', '', ' ')
List of style values resulting in no line being displayed for a curve
- class silx.gui.plot.LegendSelector.LegendIcon(parent=None)[source]
Object displaying a curve linestyle and symbol.
- class silx.gui.plot.LegendSelector.LegendModel(legendList=None, parent=None)[source]
Data model of curve legends.
It holds the information of the curve:
- color
- line width
- line style
- visibility of the lines
- symbol
- visibility of the symbols
- class silx.gui.plot.LegendSelector.LegendListItemWidget(parent=None, itemType=0)[source]
Object displaying a single item (i.e., a row) in the list.
- class silx.gui.plot.LegendSelector.LegendListView(parent=None, model=None, contextMenu=None)[source]
Widget displaying a list of curve legends, line style and symbol.
- sigLegendSignal
Signal emitting a dict when an action is triggered by the user.
- class silx.gui.plot.LegendSelector.LegendListContextMenu(model)[source]
Contextual menu associated to items in a LegendListView.
- sigContextMenu
Signal emitting a dict upon contextual menu actions.
- class silx.gui.plot.LegendSelector.RenameCurveDialog(parent=None, current='', curves=())[source]
Dialog box to input the name of a curve.
- class silx.gui.plot.LegendSelector.LegendsDockWidget(parent=None, plot=None)[source]
QDockWidget with a LegendSelector connected to a PlotWindow.
It makes the link between the LegendListView widget and the PlotWindow.
Parameters: - parent – See QDockWidget
- plot – PlotWindow instance on which to operate
- plot[source]
The PlotWindow this widget is attached to.
MaskToolsWidget
Widget providing a set of tools to draw masks on a PlotWidget.
This widget is meant to work with silx.gui.plot.PlotWidget.
- Mask: Handle mask bitmap update and history
- MaskToolsWidget: GUI for Mask
- MaskToolsDockWidget: DockWidget to integrate in PlotWindow
- class silx.gui.plot.MaskToolsWidget.Mask[source]
A mask field with update operations.
Coords follows (row, column) convention and are in mask array coords.
This is meant for internal use by MaskToolsWidget.
- sigChanged
Signal emitted when the mask has changed
- sigUndoable
Signal emitted when undo becomes possible/impossible
- sigRedoable
Signal emitted when redo becomes possible/impossible
- historyDepth = None
Maximum number of operation stored in history list for undo
- getMask(copy=True)[source]
Get the current mask as a 2D array.
Parameters: copy (bool) – True (default) to get a copy of the mask. If False, the returned array MUST not be modified. Returns: The array of the mask with dimension of the ‘active’ image. If there is no active image, an empty array is returned. Return type: 2D numpy.ndarray of uint8
- setMask(mask, copy=True)[source]
Set the mask to a new array.
Parameters: - mask (numpy.ndarray of uint8 of dimension 2, C-contiguous. Array of other types are converted.) – The array to use for the mask.
- copy (bool) – True (the default) to copy the array, False to use it as is if possible.
- save(filename, kind)[source]
Save current mask in a file
Parameters: - filename (str) – The file where to save to mask
- kind (str) – The kind of file to save in ‘edf’, ‘tif’, ‘npy’, or ‘msk’ (if FabIO is installed)
Raises Exception: Raised if the file writing fail
- clear(level)[source]
Set all values of the given mask level to 0.
Parameters: level (int) – Value of the mask to set to 0.
- reset(shape=None)[source]
Reset the mask to zero and change its shape
Parameters: shape (2-tuple of int) – Shape of the new mask or None to have an empty mask
- invert(level)[source]
Invert mask of the given mask level.
0 values become level and level values become 0.
Parameters: level (int) – The level to invert.
- updateRectangle(level, row, col, height, width, mask=True)[source]
Mask/Unmask a rectangle of the given mask level.
Parameters: - level (int) – Mask level to update.
- row (int) – Starting row of the rectangle
- col (int) – Starting column of the rectangle
- height (int) –
- width (int) –
- mask (bool) – True to mask (default), False to unmask.
- updatePolygon(level, vertices, mask=True)[source]
Mask/Unmask a polygon of the given mask level.
Parameters: - level (int) – Mask level to update.
- vertices – Nx2 array of polygon corners as (row, col)
- mask (bool) – True to mask (default), False to unmask.
- updatePoints(level, rows, cols, mask=True)[source]
Mask/Unmask points with given coordinates.
Parameters: - level (int) – Mask level to update.
- rows (1D numpy.ndarray) – Rows of selected points
- cols (1D numpy.ndarray) – Columns of selected points
- mask (bool) – True to mask (default), False to unmask.
- updateStencil(level, stencil, mask=True)[source]
Mask/Unmask area from boolean mask.
Parameters: - level (int) – Mask level to update.
- stencil (numpy.array of same dimension as the mask) – Boolean mask of mask values to update
- mask (bool) – True to mask (default), False to unmask.
- updateDisk(level, crow, ccol, radius, mask=True)[source]
Mask/Unmask a disk of the given mask level.
Parameters: - level (int) – Mask level to update.
- crow (int) – Disk center row.
- ccol (int) – Disk center column.
- radius (float) – Radius of the disk in mask array unit
- mask (bool) – True to mask (default), False to unmask.
- updateLine(level, row0, col0, row1, col1, width, mask=True)[source]
Mask/Unmask a line of the given mask level.
Parameters: - level (int) – Mask level to update.
- row0 (int) – Row of the starting point.
- col0 (int) – Column of the starting point.
- row1 (int) – Row of the end point.
- col1 (int) – Column of the end point.
- width (int) – Width of the line in mask array unit.
- mask (bool) – True to mask (default), False to unmask.
- class silx.gui.plot.MaskToolsWidget.MaskToolsWidget(parent=None, plot=None)[source]
Widget with tools for drawing mask on an image in a PlotWidget.
- getSelectionMask(copy=True)[source]
Get the current mask as a 2D array.
Parameters: copy (bool) – True (default) to get a copy of the mask. If False, the returned array MUST not be modified. Returns: The array of the mask with dimension of the ‘active’ image. If there is no active image, an empty array is returned. Return type: 2D numpy.ndarray of uint8
- setSelectionMask(mask, copy=True)[source]
Set the mask to a new array.
Parameters: - mask (numpy.ndarray of uint8 of dimension 2, C-contiguous. Array of other types are converted.) – The array to use for the mask.
- copy (bool) – True (the default) to copy the array, False to use it as is if possible.
Returns: None if failed, shape of mask as 2-tuple if successful. The mask can be cropped or padded to fit active image, the returned shape is that of the active image.
- setMultipleMasks(mode)[source]
Set the mode of multiple masks support.
Available modes:
- ‘single’: Edit a single level of mask
- ‘exclusive’: Supports to 256 levels of non overlapping masks
Parameters: mode (str) – The mode to use
- plot[source]
The PlotWindow this widget is attached to.
- setDirection(direction=0)[source]
Set the direction of the layout of the widget
Parameters: direction – QBoxLayout direction
- load(filename)[source]
Load a mask from an image file.
Parameters: filename (str) – File name from which to load the mask
Raises: - Exception – An exception in case of failure
- RuntimeWarning – In case the mask was applied but with some import changes to notice
- save(filename, kind)[source]
Save current mask in a file
Parameters: - filename (str) – The file where to save to mask
- kind (str) – The kind of file to save in ‘edf’, ‘tif’, ‘npy’
Raises Exception: Raised if the process fails
- getCurrentMaskColor()[source]
Returns the color of the current selected level.
Return type: A tuple or a python array
- resetMaskColors(level=None)[source]
Reset the mask color at the given level to be defaultColors
Parameters: level – The index of the mask for which we want to reset the color. If none we will reset color for all masks.
- class silx.gui.plot.MaskToolsWidget.MaskToolsDockWidget(parent=None, plot=None, name='Mask')[source]
MaskToolsDockWidget embedded in a QDockWidget.
For integration in a PlotWindow.
Parameters: - parent – See QDockWidget
- plot – The PlotWidget this widget is operating on
Paran str name: The title of this widget
- getSelectionMask(copy=True)[source]
Get the current mask as a 2D array.
Parameters: copy (bool) – True (default) to get a copy of the mask. If False, the returned array MUST not be modified. Returns: The array of the mask with dimension of the ‘active’ image. If there is no active image, an empty array is returned. Return type: 2D numpy.ndarray of uint8
- setSelectionMask(mask, copy=True)[source]
Set the mask to a new array.
Parameters: - mask (numpy.ndarray of uint8 of dimension 2, C-contiguous. Array of other types are converted.) – The array to use for the mask.
- copy (bool) – True (the default) to copy the array, False to use it as is if possible.
Returns: None if failed, shape of mask as 2-tuple if successful. The mask can be cropped or padded to fit active image, the returned shape is that of the active image.
ModestImage
Matplotlib computationally modest image class.
- class silx.gui.plot.ModestImage.ModestImage(*args, **kwargs)[source]
Computationally modest image class.
Customization of https://github.com/ChrisBeaumont/ModestImage to allow extent support.
ModestImage is an extension of the Matplotlib AxesImage class better suited for the interactive display of larger images. Before drawing, ModestImage resamples the data array based on the screen resolution and view window. This has very little affect on the appearance of the image, but can substantially cut down on computation since calculations of unresolved or clipped pixels are skipped.
The interface of ModestImage is the same as AxesImage. However, it does not currently support setting the ‘extent’ property. There may also be weird coordinate warping operations for images that I’m not aware of. Don’t expect those to work either.
MPLColormap
Matplotlib’s new colormaps
PlotEvents
Functions to prepare events to be sent to Plot callback.
- silx.gui.plot.PlotEvents.prepareDrawingSignal(event, type_, points, parameters=None)[source]
See Plot documentation for content of events
- silx.gui.plot.PlotEvents.prepareMouseSignal(eventType, button, xData, yData, xPixel, yPixel)[source]
See Plot documentation for content of events
- silx.gui.plot.PlotEvents.prepareHoverSignal(label, type_, posData, posPixel, draggable, selectable)[source]
See Plot documentation for content of events
- silx.gui.plot.PlotEvents.prepareMarkerSignal(eventType, button, label, type_, draggable, selectable, posDataMarker, posPixelCursor=None, posDataCursor=None)[source]
See Plot documentation for content of events
- silx.gui.plot.PlotEvents.prepareImageSignal(button, label, type_, col, row, x, y, xPixel, yPixel)[source]
See Plot documentation for content of events
PlotInteraction
Implementation of the interaction for the Plot.
- class silx.gui.plot.PlotInteraction.Pan(plot)[source]
Pan plot content and zoom on wheel state machine.
- class silx.gui.plot.PlotInteraction.Zoom(plot, color)[source]
Zoom-in/out state machine.
Zoom-in on selected area, zoom-out on right click, and zoom on mouse wheel.
- class silx.gui.plot.PlotInteraction.Select(plot, parameters, states, state)[source]
Base class for drawing selection areas.
- class silx.gui.plot.PlotInteraction.SelectPolygon(plot, parameters)[source]
Drawing selection polygon area state machine.
- class silx.gui.plot.PlotInteraction.Select2Points(plot, parameters)[source]
Base class for drawing selection based on 2 input points.
- class silx.gui.plot.PlotInteraction.SelectRectangle(plot, parameters)[source]
Drawing rectangle selection area state machine.
- class silx.gui.plot.PlotInteraction.SelectLine(plot, parameters)[source]
Drawing line selection area state machine.
- class silx.gui.plot.PlotInteraction.Select1Point(plot, parameters)[source]
Base class for drawing selection area based on one input point.
- class silx.gui.plot.PlotInteraction.SelectHLine(plot, parameters)[source]
Drawing a horizontal line selection area state machine.
- class silx.gui.plot.PlotInteraction.SelectVLine(plot, parameters)[source]
Drawing a vertical line selection area state machine.
- class silx.gui.plot.PlotInteraction.DrawFreeHand(plot, parameters)[source]
Interaction for drawing pencil. It display the preview of the pencil before pressing the mouse.
- class silx.gui.plot.PlotInteraction.SelectFreeLine(plot, parameters)[source]
Base class for drawing free lines with tools such as pencil.
- class silx.gui.plot.PlotInteraction.ItemsInteraction(plot)[source]
Interaction with items (markers, curves and images).
This class provides selection and dragging of plot primitives that support those interaction. It is also meant to be combined with the zoom interaction.
- class silx.gui.plot.PlotInteraction.FocusManager(eventHandlers=())[source]
Manages focus across multiple event handlers
On press an event handler can acquire focus. By default it looses focus when all buttons are released.
- class silx.gui.plot.PlotInteraction.ZoomAndSelect(plot, color)[source]
Combine Zoom and ItemInteraction state machine.
Parameters: - plot – The Plot to which this interaction is attached
- color – The color to use for the zoom area bounding box
- click(x, y, btn)[source]
Handle mouse click
Parameters: - x – X position of the mouse in pixels
- y – Y position of the mouse in pixels
- btn – Pressed button id
Returns: True if click is catched by an item, False otherwise
- beginDrag(x, y)[source]
Handle start drag and switching between zoom and item drag.
Parameters: - x – X position in pixels
- y – Y position in pixels
- class silx.gui.plot.PlotInteraction.PlotInteraction(plot)[source]
Proxy to currently use state machine for interaction.
This allows to switch interactive mode.
Parameters: plot – The Plot to apply interaction to - zoomOnWheel = None
True to enable zoom on wheel, False otherwise.
- getInteractiveMode()[source]
Returns the current interactive mode as a dict.
The returned dict contains at least the key ‘mode’. Mode can be: ‘draw’, ‘pan’, ‘select’, ‘zoom’. It can also contains extra keys (e.g., ‘color’) specific to a mode as provided to setInteractiveMode().
- setInteractiveMode(mode, color='black', shape='polygon', label=None, width=None)[source]
Switch the interactive mode.
Parameters: - mode (str) – The name of the interactive mode. In ‘draw’, ‘pan’, ‘select’, ‘zoom’.
- color (Color description: The name as a str or a tuple of 4 floats or None.) – Only for ‘draw’ and ‘zoom’ modes. Color to use for drawing selection area. Default black. If None, selection area is not drawn.
- shape (str) – Only for ‘draw’ mode. The kind of shape to draw. In ‘polygon’, ‘rectangle’, ‘line’, ‘vline’, ‘hline’, ‘polylines’. Default is ‘polygon’.
- label (str) – Only for ‘draw’ mode.
- width (float) – Width of the pencil. Only for draw pencil mode.
_utils
Miscellaneous utility functions
- silx.gui.plot._utils.addMarginsToLimits(margins, isXLog, isYLog, xMin, xMax, yMin, yMax, y2Min=None, y2Max=None)[source]
Returns updated limits by extending them with margins.
Parameters: margins (A 4-tuple of floats as (xMinMargin, xMaxMargin, yMinMargin, yMaxMargin)) – The ratio of the margins to add or None for no margins. Returns: The updated limits Return type: tuple of 4 or 6 floats: Either (xMin, xMax, yMin, yMax) or (xMin, xMax, yMin, yMax, y2Min, y2Max) if y2Min and y2Max are provided.
- silx.gui.plot._utils.scale1DRange(min_, max_, center, scale, isLog)[source]
Scale a 1D range given a scale factor and an center point.
Keeps the values in a smaller range than float32.
Parameters: - min (float) – The current min value of the range.
- max (float) – The current max value of the range.
- center (float) – The center of the zoom (i.e., invariant point).
- scale (float) – The scale to use for zoom
- isLog (bool) – Whether using log scale or not.
Returns: The zoomed range.
Return type: tuple of 2 floats: (min, max)
- silx.gui.plot._utils.applyZoomToPlot(plot, scaleF, center=None)[source]
Zoom in/out plot given a scale and a center point.
Parameters: - plot – The plot on which to apply zoom.
- scaleF (float) – Scale factor of zoom.
- center (2-tuple of float) – (x, y) coords in pixel coordinates of the zoom center.
- silx.gui.plot._utils.applyPan(min_, max_, panFactor, isLog10)[source]
Returns a new range with applied panning.
Moves the range according to panFactor. If isLog10 is True, converts to log10 before moving.
Parameters: - min (float) – Min value of the data range to pan.
- max (float) – Max value of the data range to pan. Must be >= min.
- panFactor (float) – Signed proportion of the range to use for pan.
- isLog10 (bool) – True if log10 scale, False if linear scale.
Returns: New min and max value with pan applied.
Return type: 2-tuple of float.

Table Of Contents
Previous topic
CurvesROIWidget: ROI from curves
Next topic
plot3d: 3D Visualisation widgets