Flatfield calibration#
Inspiration from: https://scripts.iucr.org/cgi-bin/paper?S1600577523001157
Work done for ID31: Scattering of amorphous carbon on a well defined position using a Pilatus CdTe 2M.
There are 9 positions investigated on the detector each of them contains calibration data and a flatfield image. First of all define an object container containing position, calibration, …
%matplotlib inline
# Switch from widget <-> inline for documentation purposes
import copy, time, sys
from dataclasses import dataclass
import numpy
import h5py
from matplotlib.pyplot import subplots
import fabio
from silx.resources import ExternalResources
import pyFAI
from pyFAI.gui import jupyter
from pyFAI.gui.jupyter.calib import Calibration
from pyFAI.gui.cli_calibration import AbstractCalibration

print(f"Running pyFAI version {pyFAI.version} on python {sys.version}")
t0 = time.perf_counter()
WARNING:pyFAI.gui.matplotlib:Matplotlib already loaded with backend `inline`, setting its backend to `QtAgg` may not work!
Running pyFAI version 2026.6.0-dev0 on python 3.14.0 | packaged by conda-forge | (main, Oct 22 2025, 23:24:08) [GCC 14.3.0]
polarization = 0.999
npt = 512
energy = 75 #keV
wavelength = 1e-10*pyFAI.units.hc/energy
detector = pyFAI.detector_factory("Pilatus2M_CdTe")
calibrant = pyFAI.calibrant.CALIBRANT_FACTORY("AgBh")
calibrant.wavelength = wavelength
# Here we download the test data

downloader = ExternalResources("flatfield", "http://www.silx.org/pub/pyFAI/testimages")
all_files = downloader.getdir("flatfield_ID31.tar.bz2")
master_file = [i for i in all_files if i.endswith("calibration_0001.h5")][0]
print(master_file)
/tmp/flatfield_testdata_kieffer/flatfield_ID31.tar.bz2__content/flatfield_ID31/calibration_0001.h5
@dataclass
class Position:
    """All data related to one of the position"""
    position: int
    calibration_idx: int
    scattering_idx: int
    coordinates: tuple=tuple()
    calibration_data: object=None
    scattering_data: object=None
    poni: object=None
    ai: object=None
    control_points: object=None
    flatfield: object=None

    @classmethod
    def init(cls, h5_file, position, calibration_idx, scattering_idx, detector_name="p3", positioners=("cncx","cncy","cncz")):
        with h5py.File(h5_file) as h:
            calibration_str = f"{calibration_idx}."
            scattering_str = f"{scattering_idx}."
            keys = list(h.keys())
            ids = [i for i in keys if i.startswith(calibration_str)]
            if ids:
                entry = h[ids[0]]
                calibration_data = entry[f"measurement/{detector_name}"][0]
                coordinates = tuple(entry[f"instrument/positioners/{positioner}"][()] for positioner in positioners)
            else:
                raise IndexError(f"no such Entry {calibration_idx}")
            ids = [i for i in keys if i.startswith(scattering_str)]
            if ids:
                entry = h[ids[0]]
                scattering_data = entry[f"measurement/{detector_name}"][0]
                coordinates = tuple(entry[f"instrument/positioners/{positioner}"][()] for positioner in positioners)
            else:
                raise IndexError(f"no such Entry {calibration_idx}")
        return cls(position, calibration_idx, scattering_idx, coordinates, calibration_data, scattering_data)

center = Position.init(master_file, "CC", 14, 13)
center
Position(position='CC', calibration_idx=14, scattering_idx=13, coordinates=(np.float64(6489.605), np.float64(20.0), np.float64(20.0)), calibration_data=array([[2728, 2784, 2791, ..., 1582, 1636, 1544],
       [2664, 2663, 2829, ..., 1542, 1485, 1533],
       [2839, 2739, 2674, ..., 1542, 1581, 1478],
       ...,
       [3216, 2998, 3165, ..., 3048, 2992, 3125],
       [3121, 3252, 3299, ..., 3086, 3110, 2913],
       [3231, 3261, 3414, ..., 3099, 3039, 3020]],
      shape=(1679, 1475), dtype=int32), scattering_data=array([[102929, 101856, 105155, ...,  36466,  36234,  35175],
       [100320,  98901, 104158, ...,  35047,  34531,  35871],
       [102334, 101772,  98380, ...,  35634,  35428,  34703],
       ...,
       [ 96866,  94780,  96978, ...,  95870,  94463,  97045],
       [ 97101,  99105,  99604, ...,  97634,  97246,  94603],
       [100027,  99620, 102607, ...,  95336,  96377,  94539]],
      shape=(1679, 1475), dtype=int32), poni=None, ai=None, control_points=None, flatfield=None)
# This contains which scan correspond to what position and if it contains amorphous scattering or calibration data.
data =[None,
       Position.init(master_file, 1, 1, 5),
       Position.init(master_file, 2, 7, 6),
       Position.init(master_file, 3, 8, 9),
       Position.init(master_file, 4, 11, 12),
       Position.init(master_file, 5, 14, 13),
       Position.init(master_file, 6, 15, 16),
       Position.init(master_file, 7, 18, 17),
       Position.init(master_file, 8, 19, 20),
       Position.init(master_file, 9, 22, 21)]
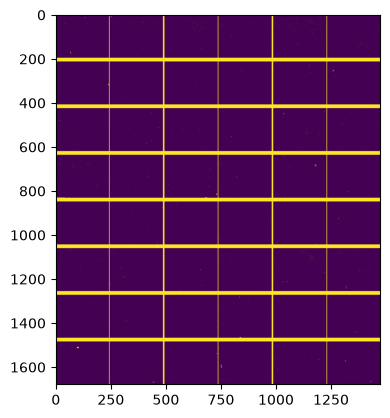
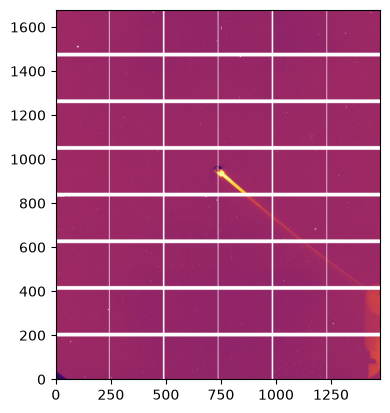
#calculate the mask:

mask = -detector.mask.astype(int)
for p in data[1:]:
    numpy.minimum(mask, p.scattering_data, out=mask)
    numpy.minimum(mask, p.calibration_data, out=mask)
detector.mask = (mask<0).astype(numpy.int8)
fig, ax = subplots()
ax.imshow(detector.mask)
<matplotlib.image.AxesImage at 0x7ff3a8283a10>
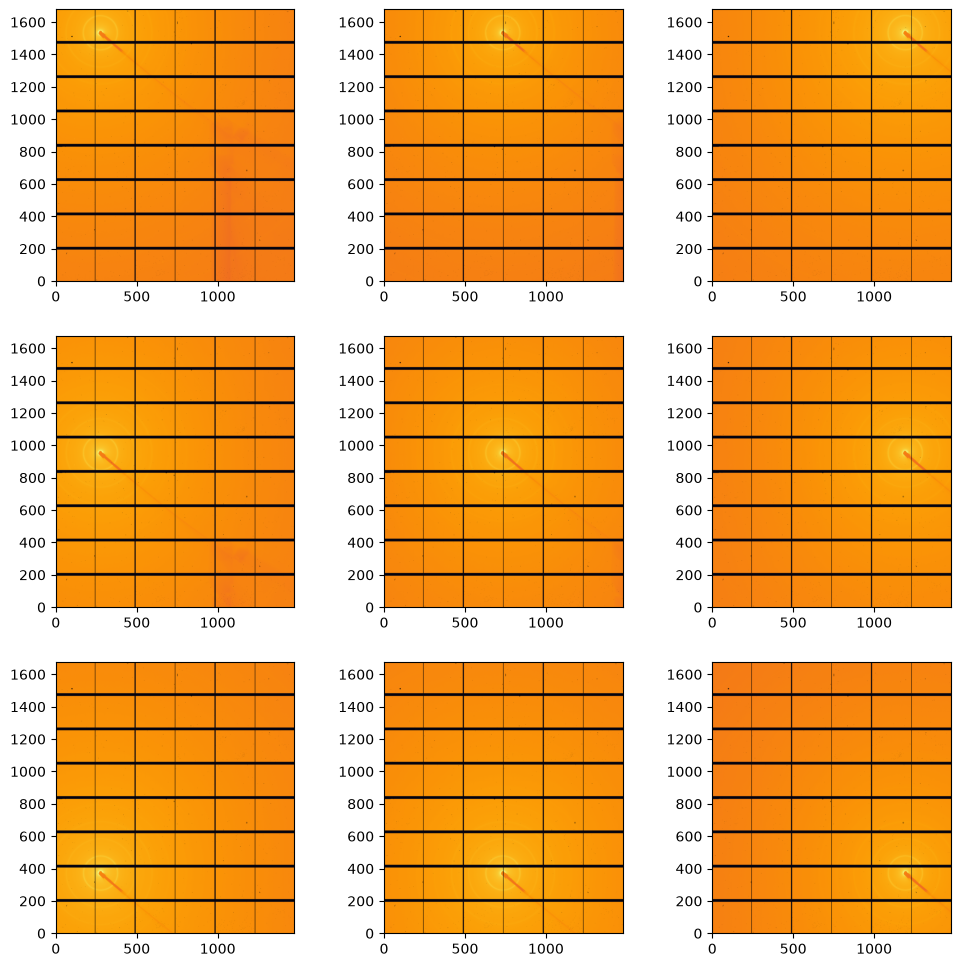
#display calibraation scattering:
fig, ax = subplots(3,3, figsize=(12,12))
jupyter.display(data[1].calibration_data, ax=ax[0,2])
jupyter.display(data[2].calibration_data, ax=ax[0,1])
jupyter.display(data[3].calibration_data, ax=ax[0,0])
jupyter.display(data[4].calibration_data, ax=ax[1,0])
jupyter.display(data[5].calibration_data, ax=ax[1,1])
jupyter.display(data[6].calibration_data, ax=ax[1,2])
jupyter.display(data[7].calibration_data, ax=ax[2,2])
jupyter.display(data[8].calibration_data, ax=ax[2,1])
jupyter.display(data[9].calibration_data, ax=ax[2,0]);
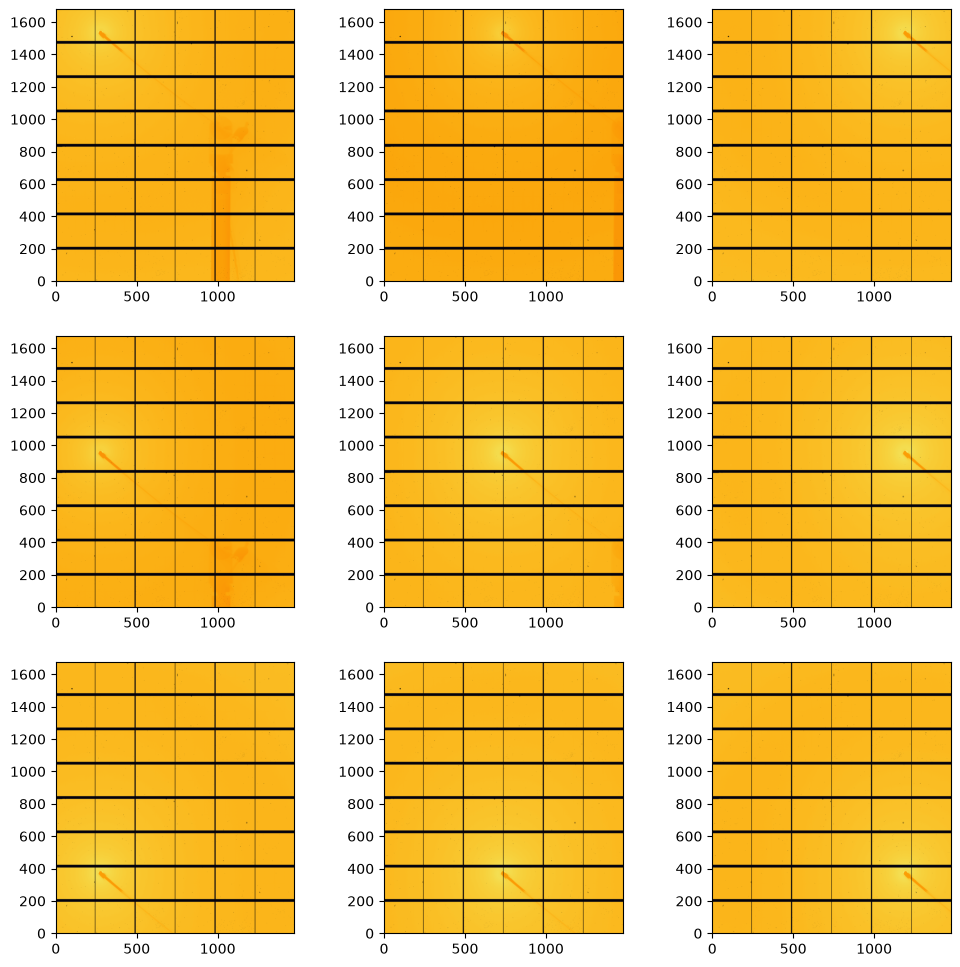
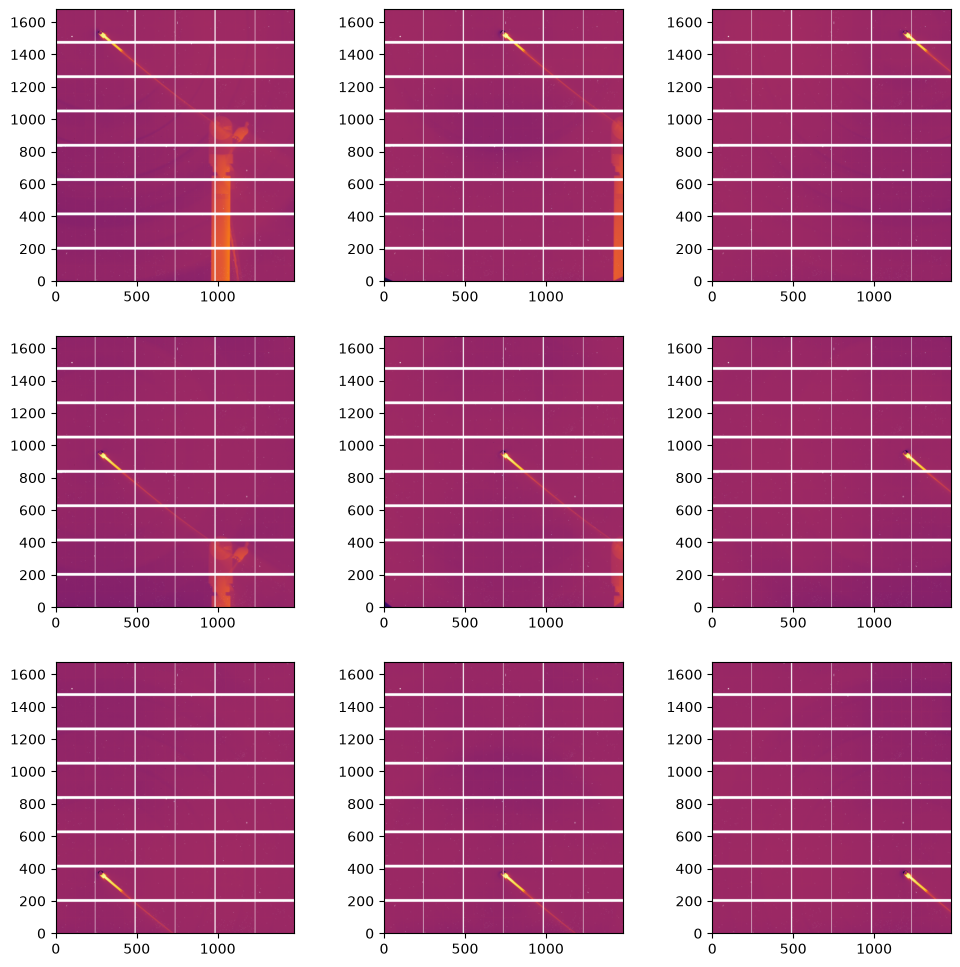
#display amorphous scattering:
fig, ax = subplots(3,3, figsize=(12,12))
jupyter.display(data[1].scattering_data, ax=ax[0,2])
jupyter.display(data[2].scattering_data, ax=ax[0,1])
jupyter.display(data[3].scattering_data, ax=ax[0,0])
jupyter.display(data[4].scattering_data, ax=ax[1,0])
jupyter.display(data[5].scattering_data, ax=ax[1,1])
jupyter.display(data[6].scattering_data, ax=ax[1,2])
jupyter.display(data[7].scattering_data, ax=ax[2,2])
jupyter.display(data[8].scattering_data, ax=ax[2,1])
jupyter.display(data[9].scattering_data, ax=ax[2,0]);
Calibration of the central position#
%matplotlib widget
extra_mask = center.calibration_data<5000
# switch to widget mode ... for calibration purpose. Use right click.
calib = Calibration(center.calibration_data,
                    calibrant=calibrant,
                    wavelength=calibrant.wavelength,
                    detector=copy.deepcopy(detector),
                    mask=extra_mask)  # Mind the mask option mangles the detector's mask !
input("Please perform the calibration in the previous cell before going on ... use the right-click")
%matplotlib inline
fig, ax = subplots()
#Reset the mask
calib.mask=None
calib.geoRef.detector = detector
print(calib.geoRef)
f2d = calib.geoRef.getFit2D()
f2d["tilt"] = 0
# f2d.pop("splineFile")
print(f2d)
calib.geoRef.setFit2D(**f2d)
print(calib.geoRef)
calib.fixed += ["rot1", "rot2"]
print(calib.fixed)
Detector Pilatus CdTe 2M	 PixelSize= 172µm, 172µm	 BottomRight (3)
Wavelength= 0.165312 Å
SampleDetDist= 6.405803e+00 m	PONI= 1.569097e-01, 1.060665e-01 m	rot1=-0.003175  rot2=0.001132  rot3=0.000000 rad
DirectBeamDist= 6405.840 mm	Center: x=734.924, y=954.408 pix	Tilt= 0.193° tiltPlanRotation= 19.614° λ= 0.165Å
DirectBeamDist= 6405.840 mm	Center: x=734.924, y=954.408 pix	Tilt= 0.000° tiltPlanRotation= 19.614° λ= 0.165Å
Detector Pilatus CdTe 2M	 PixelSize= 172µm, 172µm	 BottomRight (3)
Wavelength= 0.165312 Å
SampleDetDist= 6.405840e+00 m	PONI= 1.641582e-01, 1.264069e-01 m	rot1=0.000000  rot2=0.000000  rot3=0.000000 rad
DirectBeamDist= 6405.840 mm	Center: x=734.924, y=954.408 pix	Tilt= 0.000° tiltPlanRotation= 0.000° λ= 0.165Å
Fixed parameters: rot2, rot1, rot3, wavelength.
logger = pyFAI.gui.cli_calibration.logger
from silx.image import marchingsquares
def extract_cpt(self, method="massif", pts_per_deg=1.0, max_rings=numpy.iinfo(int).max):
        """
        Performs an automatic keypoint extraction:
        Can be used in recalib or in calib after a first calibration has been performed.

        :param method: method for keypoint extraction
        :param pts_per_deg: number of control points per azimuthal degree (increase for better precision)
        :param max_rings: extract at most max_rings
        """

        logger.info("in extract_cpt with method %s", method)
        assert self.ai
        assert self.calibrant
        assert self.peakPicker
        self.peakPicker.reset()
        self.peakPicker.init(method, False)
        if self.geoRef:
            self.ai.set_config(self.geoRef.get_config())
        tth = numpy.array([i for i in self.calibrant.get_2th() if i is not None])
        tth = numpy.unique(tth)
        tth_min = numpy.zeros_like(tth)
        tth_max = numpy.zeros_like(tth)
        delta = (tth[1:] - tth[:-1]) / 4.0
        tth_max[:-1] = delta
        tth_max[-1] = delta[-1]
        tth_min[1:] = -delta
        tth_min[0] = -delta[0]
        tth_max += tth
        tth_min += tth

        shape = self.peakPicker.data.shape
        if self.geoRef:
            ttha = self.geoRef.center_array(shape, unit="2th_rad", scale=False)
            chia = self.geoRef.center_array(shape, unit="chi_rad", scale=False)
        else:
            ttha = self.ai.center_array(shape, unit="2th_rad", scale=False)
            chia = self.ai.center_array(shape, unit="chi_rad", scale=False)
        rings = 0
        self.peakPicker.sync_init()
        if self.max_rings is None:
            self.max_rings = tth.size

        ms = marchingsquares.MarchingSquaresMergeImpl(ttha, self.mask, use_minmax_cache=True)
        for i in range(tth.size):
            if rings >= min(self.max_rings, max_rings):
                break
            mask1 = numpy.logical_and(ttha >= tth_min[i], ttha < tth_max[i])
            if self.mask is not None:
                numpy.logical_and(mask1, numpy.logical_not(self.mask), out=mask1)

            size = mask1.sum(dtype=int)
            if (size > 0):
                rings += 1
                self.peakPicker.massif_contour(mask1)
                # if self.gui:
                #     self.peakPicker.widget.update()
                sub_data = self.peakPicker.data.ravel()[numpy.where(mask1.ravel())]
                mean = sub_data.mean(dtype=numpy.float64)
                std = sub_data.std(dtype=numpy.float64)
                upper_limit = mean + std
                mask2 = numpy.logical_and(self.peakPicker.data > upper_limit, mask1)
                size2 = mask2.sum(dtype=int)
                if size2 < 1000:
                    upper_limit = mean
                    numpy.logical_and(self.peakPicker.data > upper_limit, mask1, out=mask2)
                    size2 = mask2.sum()
                # length of the arc:
                points = ms.find_pixels(tth[i])
                seeds = set((i[0], i[1]) for i in points if mask2[i[0], i[1]])
                # max number of points: 360 points for a full circle
                azimuthal = chia[points[:, 0].clip(0, self.peakPicker.data.shape[0]), points[:, 1].clip(0, self.peakPicker.data.shape[1])]
                nb_deg_azim = numpy.unique(numpy.rad2deg(azimuthal).round()).size
                keep = int(nb_deg_azim * pts_per_deg)
                if keep == 0:
                    continue
                dist_min = len(seeds) / 2.0 / keep
                # why 3.0, why not ?

                logger.info("Extracting datapoint for ring %s (2theta = %.2f deg); "
                            "searching for %i pts out of %i with I>%.1f, dmin=%.1f" %
                            (i, numpy.degrees(tth[i]), keep, size2, upper_limit, dist_min))
                _res = self.peakPicker.peaks_from_area(mask=mask2, Imin=upper_limit, keep=keep, method=method, ring=i, dmin=dist_min, seed=seeds)

        if self.basename:
            self.peakPicker.points.save(self.basename + ".npt")
        if self.weighted:
            self.data = self.peakPicker.points.getWeightedList(self.peakPicker.data)
        else:
            self.data = self.peakPicker.points.getList()
        if self.geoRef:
            self.geoRef.data = numpy.array(self.data, dtype=numpy.float64)
Calibration.extract_cpt = extract_cpt
calib.extract_cpt(max_rings=4)
calib.refine()
Before refinement, the geometry is:
Detector Pilatus CdTe 2M	 PixelSize= 172µm, 172µm	 BottomRight (3)
Wavelength= 0.165312 Å
SampleDetDist= 6.405840e+00 m	PONI= 1.641582e-01, 1.264069e-01 m	rot1=0.000000  rot2=0.000000  rot3=0.000000 rad
DirectBeamDist= 6405.840 mm	Center: x=734.924, y=954.408 pix	Tilt= 0.000° tiltPlanRotation= 0.000° λ= 0.165Å
Detector Pilatus CdTe 2M	 PixelSize= 172µm, 172µm	 BottomRight (3)
Wavelength= 0.165312 Å
SampleDetDist= 6.424405e+00 m	PONI= 1.641413e-01, 1.264188e-01 m	rot1=0.000000  rot2=0.000000  rot3=0.000000 rad
DirectBeamDist= 6424.405 mm	Center: x=734.993, y=954.310 pix	Tilt= 0.000° tiltPlanRotation= 0.000° λ= 0.165Å
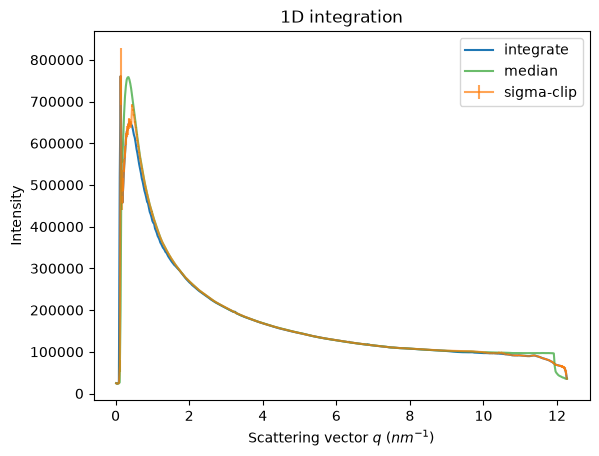
ai = calib.geoRef.promote("pyFAI.integrator.azimuthal.AzimuthalIntegrator")
it = ai.integrate1d(center.scattering_data, npt, polarization_factor=polarization, error_model="no", method=("no", "csr", "cython"))
sc = ai.sigma_clip(center.scattering_data, npt, polarization_factor=polarization, error_model="azimuthal", method=("no", "csr", "cython"),
                  thres=0, max_iter=3)
md = ai.medfilt1d_ng(center.scattering_data, npt, polarization_factor=polarization, method=("full", "csr", "cython"))
fig, ax = subplots()
ax = jupyter.plot1d(it, label="integrate", ax=ax)
ax.errorbar(*sc, alpha=0.7, label="sigma-clip")
ax.plot(*md, alpha=0.7, label="median")
# ax.set_yscale("log")
ax.legend();
# Approximate polarization correction needed:
print(f"Approximate polarization factor: {ai.guess_polarization(center.scattering_data, unit='q_nm^-1', target_rad=10):.4f}")
Approximate polarization factor: 0.9989
# median filter provides the smoothest curve achievable
rebuilt = ai.calcfrom1d(md.radial,
                        md.intensity,
                        detector.shape,
                        dim1_unit=pyFAI.units.Q_NM,
                        polarization_factor=polarization)
flat = rebuilt/center.scattering_data
flat[numpy.where(detector.mask)] = numpy.nan
flat[center.scattering_data<=0] = numpy.nan
jupyter.display(flat);
/tmp/ipykernel_1799216/625551917.py:7: RuntimeWarning: divide by zero encountered in divide
  flat = rebuilt/center.scattering_data
Calculate the approximate correction of the other positions#
dx,dy,dz = numpy.array(data[1].coordinates)-center.coordinates
ai1 = copy.copy(ai)
ai1.poni1 += dz*0.001
ai1.poni2 += dy*0.001
ai1
Detector Pilatus CdTe 2M	 PixelSize= 172µm, 172µm	 BottomRight (3)
Wavelength= 0.165312 Å
SampleDetDist= 6.424405e+00 m	PONI= 2.641413e-01, 2.051588e-01 m	rot1=0.000000  rot2=0.000000  rot3=0.000000 rad
DirectBeamDist= 6424.405 mm	Center: x=1192.784, y=1535.705 pix	Tilt= 0.000° tiltPlanRotation= 0.000° λ= 0.165Å
AbstractCalibration.extract_cpt = extract_cpt
calib1 = AbstractCalibration(data[1].calibration_data, detector.mask, detector, wavelength=wavelength, calibrant=calibrant)
calib1.preprocess()
calib1.data = []
calib1.geoRef = calib1.initgeoRef()
calib1.geoRef.set_config(ai1.get_config())
Detector Pilatus CdTe 2M	 PixelSize= 172µm, 172µm	 BottomRight (3)
Wavelength= 0.165312 Å
SampleDetDist= 6.424405e+00 m	PONI= 2.641413e-01, 2.051588e-01 m	rot1=0.000000  rot2=0.000000  rot3=0.000000 rad
DirectBeamDist= 6424.405 mm	Center: x=1192.784, y=1535.705 pix	Tilt= 0.000° tiltPlanRotation= 0.000° λ= 0.165Å
calib1.extract_cpt(max_rings=4)
ERROR:root:No diffraction image available => not showing the contour
ERROR:root:No diffraction image available => not showing the contour
ERROR:root:No diffraction image available => not showing the contour
ERROR:root:No diffraction image available => not showing the contour
calib1.fixed += ["rot1", "rot2"]
calib1.geoRef.refine3(fix=calib1.fixed)
calib1.fixed
Fixed parameters: rot2, rot1, rot3, wavelength.
calib1.geoRef
Detector Pilatus CdTe 2M	 PixelSize= 172µm, 172µm	 BottomRight (3)
Wavelength= 0.165312 Å
SampleDetDist= 6.434843e+00 m	PONI= 2.640766e-01, 2.050791e-01 m	rot1=0.000000  rot2=0.000000  rot3=0.000000 rad
DirectBeamDist= 6434.843 mm	Center: x=1192.321, y=1535.329 pix	Tilt= 0.000° tiltPlanRotation= 0.000° λ= 0.165Å
data[1].ai = pyFAI.load(calib1.geoRef)
data[1].control_points = calib1.peakPicker.points
data[5].ai = pyFAI.load(calib.geoRef)
data[5].control_points = calib.peakPicker.points
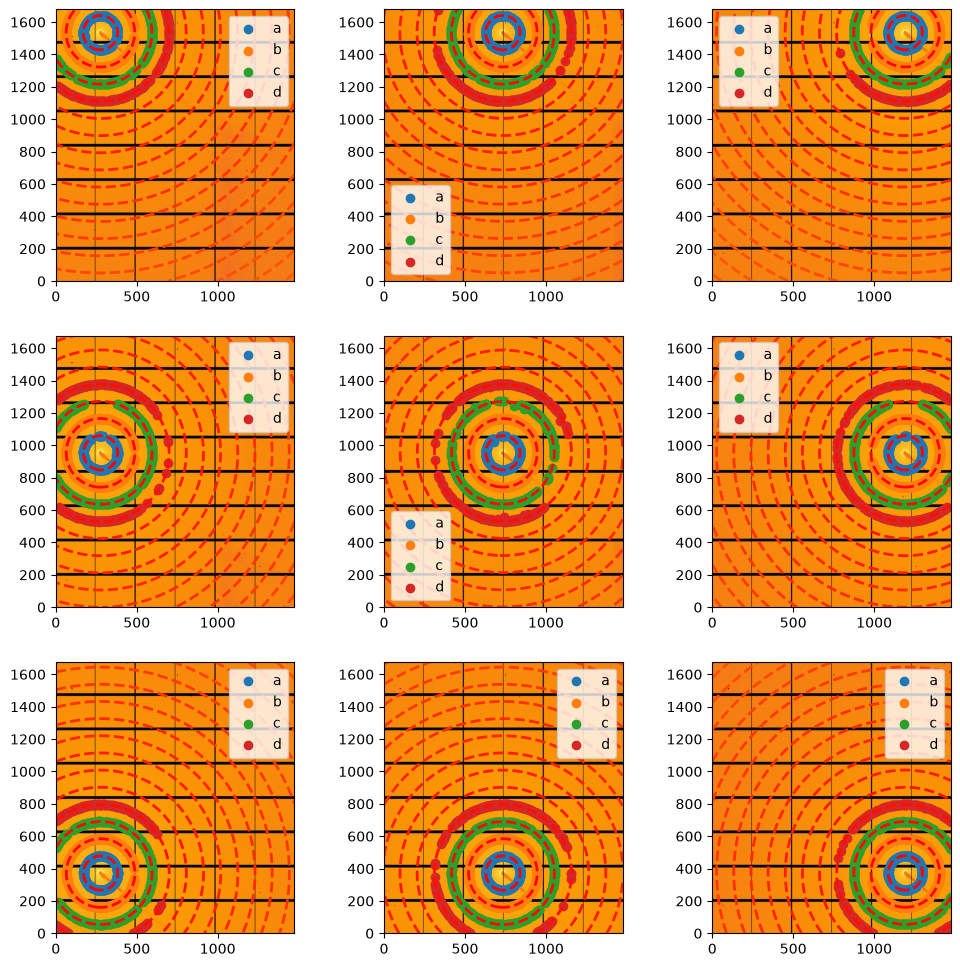
Perform the geometry extraction for each of the positions:#
for idx in [2,3,4,6,7,8,9]:
    dx,dy,dz = numpy.array(data[idx].coordinates)-center.coordinates
    ain = copy.copy(ai)
    ain.poni1 += dz*0.001
    ain.poni2 += dy*0.001
    calibn = AbstractCalibration(data[idx].calibration_data, detector.mask, detector, wavelength=wavelength, calibrant=calibrant)
    calibn.preprocess()
    calibn.data = []
    calibn.geoRef = calib1.initgeoRef()
    calibn.geoRef.set_config(ain.get_config())
    calibn.extract_cpt(max_rings=4)
    calibn.fixed += ["rot1", "rot2"]
    calibn.geoRef.refine3(fix=calibn.fixed)
    print(f"#### Position {idx} ####")
    print(calibn.geoRef)
    data[idx].ai = pyFAI.load(calibn.geoRef)
    data[idx].control_points = calibn.peakPicker.points
ERROR:root:No diffraction image available => not showing the contour
ERROR:root:No diffraction image available => not showing the contour
ERROR:root:No diffraction image available => not showing the contour
ERROR:root:No diffraction image available => not showing the contour
#### Position 2 ####
Detector Pilatus CdTe 2M	 PixelSize= 172µm, 172µm	 BottomRight (3)
Wavelength= 0.165312 Å
SampleDetDist= 6.435244e+00 m	PONI= 2.640882e-01, 1.262873e-01 m	rot1=0.000000  rot2=0.000000  rot3=0.000000 rad
DirectBeamDist= 6435.244 mm	Center: x=734.228, y=1535.397 pix	Tilt= 0.000° tiltPlanRotation= 0.000° λ= 0.165Å
ERROR:root:No diffraction image available => not showing the contour
ERROR:root:No diffraction image available => not showing the contour
ERROR:root:No diffraction image available => not showing the contour
ERROR:root:No diffraction image available => not showing the contour
#### Position 3 ####
Detector Pilatus CdTe 2M	 PixelSize= 172µm, 172µm	 BottomRight (3)
Wavelength= 0.165312 Å
SampleDetDist= 6.435755e+00 m	PONI= 2.640254e-01, 4.749302e-02 m	rot1=0.000000  rot2=0.000000  rot3=0.000000 rad
DirectBeamDist= 6435.755 mm	Center: x=276.122, y=1535.031 pix	Tilt= 0.000° tiltPlanRotation= 0.000° λ= 0.165Å
ERROR:root:No diffraction image available => not showing the contour
ERROR:root:No diffraction image available => not showing the contour
ERROR:root:No diffraction image available => not showing the contour
ERROR:root:No diffraction image available => not showing the contour
#### Position 4 ####
Detector Pilatus CdTe 2M	 PixelSize= 172µm, 172µm	 BottomRight (3)
Wavelength= 0.165312 Å
SampleDetDist= 6.435248e+00 m	PONI= 1.641139e-01, 4.762845e-02 m	rot1=0.000000  rot2=0.000000  rot3=0.000000 rad
DirectBeamDist= 6435.248 mm	Center: x=276.910, y=954.151 pix	Tilt= 0.000° tiltPlanRotation= 0.000° λ= 0.165Å
ERROR:root:No diffraction image available => not showing the contour
ERROR:root:No diffraction image available => not showing the contour
ERROR:root:No diffraction image available => not showing the contour
ERROR:root:No diffraction image available => not showing the contour
#### Position 6 ####
Detector Pilatus CdTe 2M	 PixelSize= 172µm, 172µm	 BottomRight (3)
Wavelength= 0.165312 Å
SampleDetDist= 6.434118e+00 m	PONI= 1.641396e-01, 2.051663e-01 m	rot1=0.000000  rot2=0.000000  rot3=0.000000 rad
DirectBeamDist= 6434.118 mm	Center: x=1192.827, y=954.300 pix	Tilt= 0.000° tiltPlanRotation= 0.000° λ= 0.165Å
ERROR:root:No diffraction image available => not showing the contour
ERROR:root:No diffraction image available => not showing the contour
ERROR:root:No diffraction image available => not showing the contour
ERROR:root:No diffraction image available => not showing the contour
#### Position 7 ####
Detector Pilatus CdTe 2M	 PixelSize= 172µm, 172µm	 BottomRight (3)
Wavelength= 0.165312 Å
SampleDetDist= 6.434891e+00 m	PONI= 6.421732e-02, 2.052243e-01 m	rot1=0.000000  rot2=0.000000  rot3=0.000000 rad
DirectBeamDist= 6434.891 mm	Center: x=1193.165, y=373.357 pix	Tilt= 0.000° tiltPlanRotation= 0.000° λ= 0.165Å
ERROR:root:No diffraction image available => not showing the contour
ERROR:root:No diffraction image available => not showing the contour
ERROR:root:No diffraction image available => not showing the contour
ERROR:root:No diffraction image available => not showing the contour
#### Position 8 ####
Detector Pilatus CdTe 2M	 PixelSize= 172µm, 172µm	 BottomRight (3)
Wavelength= 0.165312 Å
SampleDetDist= 6.436814e+00 m	PONI= 6.413669e-02, 1.264317e-01 m	rot1=0.000000  rot2=0.000000  rot3=0.000000 rad
DirectBeamDist= 6436.814 mm	Center: x=735.068, y=372.888 pix	Tilt= 0.000° tiltPlanRotation= 0.000° λ= 0.165Å
ERROR:root:No diffraction image available => not showing the contour
ERROR:root:No diffraction image available => not showing the contour
ERROR:root:No diffraction image available => not showing the contour
ERROR:root:No diffraction image available => not showing the contour
#### Position 9 ####
Detector Pilatus CdTe 2M	 PixelSize= 172µm, 172µm	 BottomRight (3)
Wavelength= 0.165312 Å
SampleDetDist= 6.436799e+00 m	PONI= 6.412959e-02, 4.770252e-02 m	rot1=0.000000  rot2=0.000000  rot3=0.000000 rad
DirectBeamDist= 6436.799 mm	Center: x=277.340, y=372.846 pix	Tilt= 0.000° tiltPlanRotation= 0.000° λ= 0.165Å
#display scattering:
fig, ax = subplots(3,3, figsize=(12,12))
jupyter.display(data[1].calibration_data, ai=data[1].ai, cp=data[1].control_points, ax=ax[0,2])
jupyter.display(data[2].calibration_data, ai=data[2].ai, cp=data[2].control_points, ax=ax[0,1])
jupyter.display(data[3].calibration_data, ai=data[3].ai, cp=data[3].control_points, ax=ax[0,0])
jupyter.display(data[4].calibration_data, ai=data[4].ai, cp=data[4].control_points, ax=ax[1,0])
jupyter.display(data[5].calibration_data, ai=data[5].ai, cp=data[5].control_points, ax=ax[1,1])
jupyter.display(data[6].calibration_data, ai=data[6].ai, cp=data[6].control_points, ax=ax[1,2])
jupyter.display(data[7].calibration_data, ai=data[7].ai, cp=data[7].control_points, ax=ax[2,2])
jupyter.display(data[8].calibration_data, ai=data[8].ai, cp=data[8].control_points, ax=ax[2,1])
jupyter.display(data[9].calibration_data, ai=data[9].ai, cp=data[9].control_points, ax=ax[2,0]);
Extract the flatfield for all positions#
for p in data[1:]:
    md = p.ai.medfilt1d_ng(p.scattering_data, npt, polarization_factor=polarization, method=("full", "csr", "cython"))
    rebuilt = p.ai.calcfrom1d(md.radial, md.intensity, detector.shape, dim1_unit=pyFAI.units.Q_NM, polarization_factor=polarization)
    flat = rebuilt / p.scattering_data
    flat[numpy.where(detector.mask)] = numpy.nan
    flat[p.scattering_data<=0] = numpy.nan
    p.flat = flat
/tmp/ipykernel_1799216/3685900361.py:4: RuntimeWarning: divide by zero encountered in divide
  flat = rebuilt / p.scattering_data
#display flat:
fig, ax = subplots(3,3, figsize=(12,12))
jupyter.display(data[1].flat, ax=ax[0,2])
jupyter.display(data[2].flat, ax=ax[0,1])
jupyter.display(data[3].flat, ax=ax[0,0])
jupyter.display(data[4].flat, ax=ax[1,0])
jupyter.display(data[5].flat, ax=ax[1,1])
jupyter.display(data[6].flat, ax=ax[1,2])
jupyter.display(data[7].flat, ax=ax[2,2])
jupyter.display(data[8].flat, ax=ax[2,1])
jupyter.display(data[9].flat, ax=ax[2,0]);
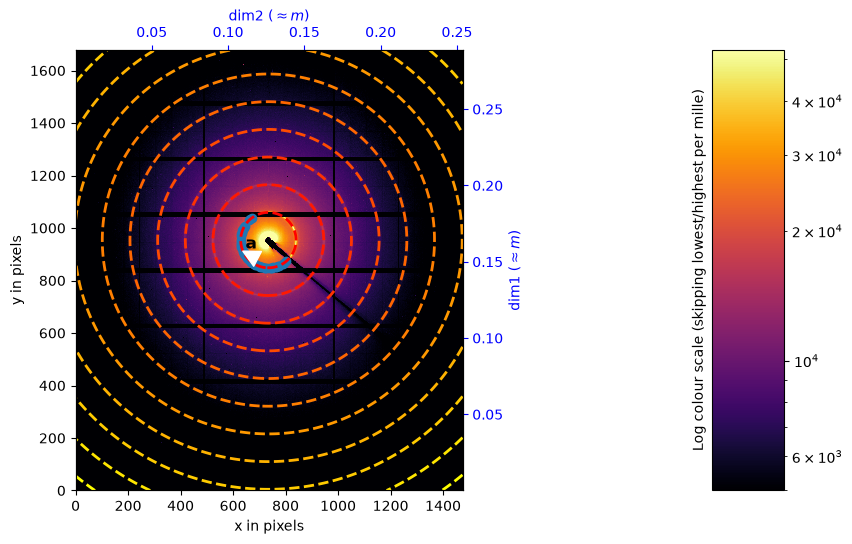
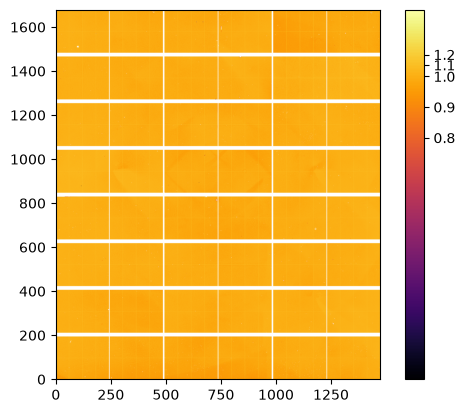
The final flatfield is the median of the flats calculated on the 9 positions#
flat_stack = numpy.array([p.flat for p in data[1:]])
flat = numpy.nanmedian(flat_stack, axis=0)
/tmp/ipykernel_1799216/4120576390.py:2: RuntimeWarning: All-NaN slice encountered
  flat = numpy.nanmedian(flat_stack, axis=0)
ax = jupyter.display(flat)
cb = ax.figure.colorbar(ax.images[0]);
pos = numpy.linspace(0.8,1.2, 5)
ticks = [str(i) for i in pos]
cb.set_ticks(pos, labels=ticks);
fabio.edfimage.EdfImage(data=flat.astype("float32")).write("flat.edf")
print(f"Total run time: {time.perf_counter()-t0:.3f}s.")
Total run time: 145.619s.