tools: Tool widgets for PlotWidget
This package provides a set of widgets working with PlotWidget.
It provides some QToolBar and QWidget:
It also provides a roi module to handle
interactive region of interest on a PlotWidget.
Tools API
Tools are divided into the following sub-modules:
Other tools API
PositionInfo class
- class PositionInfo(parent=None, plot=None, converters=None)[source]
Bases:
PyQt5.QtWidgets.QWidgetQWidget displaying coords converted from data coords of the mouse.
Provide this widget with a list of couple:
A name to display before the data
A function that takes (x, y) as arguments and returns something that gets converted to a string. If the result is a float it is converted with ‘%.7g’ format.
To run the following sample code, a QApplication must be initialized. First, create a PlotWindow and add a QToolBar where to place the PositionInfo widget.
>>> from silx.gui.plot import PlotWindow
>>> from silx.gui import qt
>>> plot = PlotWindow()  # Create a PlotWindow to add the widget to
>>> toolBar = qt.QToolBar()  # Create a toolbar to place the widget in
>>> plot.addToolBar(qt.Qt.BottomToolBarArea, toolBar)  # Add it to plot
Then, create the PositionInfo widget and add it to the toolbar. The PositionInfo widget is created with a list of converters, here to display polar coordinates of the mouse position.
>>> import numpy
>>> from silx.gui.plot.tools import PositionInfo
>>> position = PositionInfo(plot=plot, converters=[
...     ('Radius', lambda x, y: numpy.sqrt(x*x + y*y)),
...     ('Angle', lambda x, y: numpy.degrees(numpy.arctan2(y, x)))])
>>> toolBar.addWidget(position)  # Add the widget to the toolbar
<...>
>>> plot.show()  # To display the PlotWindow with the position widget
- Parameters
plot – The PlotWidget this widget is displaying data coords from.
converters – List of 2-tuple: name to display and conversion function from (x, y) in data coords to displayed value. If None, the default, it displays X and Y.
parent – Parent widget
- getPlotWidget()[source]
Returns the PlotWidget this widget is attached to or None.
- Return type
Union[PlotWidget,None]
- SNAPPING_DISABLED = 0
No snapping occurs
- SNAPPING_CROSSHAIR = 1
Snapping only enabled when crosshair cursor is enabled
- SNAPPING_ACTIVE_ONLY = 2
Snapping only enabled for active item
- SNAPPING_SYMBOLS_ONLY = 4
Snapping only when symbols are visible
- SNAPPING_CURVE = 8
Snapping on curves
- SNAPPING_SCATTER = 16
Snapping on scatter
LimitsToolBar class
- class LimitsToolBar(parent=None, plot=None, title='Limits')[source]
Bases:
PyQt5.QtWidgets.QToolBarQToolBar displaying and controlling the limits of a
PlotWidget.To run the following sample code, a QApplication must be initialized. First, create a PlotWindow:
>>> from silx.gui.plot import PlotWindow
>>> plot = PlotWindow()  # Create a PlotWindow to add the toolbar to
Then, create the LimitsToolBar and add it to the PlotWindow.
>>> from silx.gui import qt
>>> from silx.gui.plot.tools import LimitsToolBar
>>> toolbar = LimitsToolBar(plot=plot)  # Create the toolbar
>>> plot.addToolBar(qt.Qt.BottomToolBarArea, toolbar)  # Add it to the plot
>>> plot.show()  # To display the PlotWindow with the limits toolbar
- Parameters
parent – See
QToolBar.plot –
PlotWidgetinstance on which to operate.title (str) – See
QToolBar.
- property plot
The
PlotWidgetthe toolbar is attached to.
InteractiveModeToolBar class
- class InteractiveModeToolBar(parent=None, plot=None, title='Plot Interaction')[source]
Bases:
PyQt5.QtWidgets.QToolBarToolbar with interactive mode actions
- Parameters
parent – See
QWidgetplot (silx.gui.plot.PlotWidget) – PlotWidget to control
title (str) – Title of the toolbar.
OutputToolBar class
- class OutputToolBar(parent=None, plot=None, title='Plot Output')[source]
Bases:
PyQt5.QtWidgets.QToolBarToolbar providing icons to copy, save and print a PlotWidget
- Parameters
parent – See
QWidgetplot (silx.gui.plot.PlotWidget) – PlotWidget to control
title (str) – Title of the toolbar.
- getCopyAction()[source]
Returns the QAction performing copy to clipboard of the PlotWidget
- Return type
ImageToolBar class
- class ImageToolBar(parent=None, plot=None, title='Image')[source]
Bases:
PyQt5.QtWidgets.QToolBarToolbar providing PlotAction suited when displaying images
- Parameters
parent – See
QWidgetplot (silx.gui.plot.PlotWidget) – PlotWidget to control
title (str) – Title of the toolbar.
CurveToolBar class
- class CurveToolBar(parent=None, plot=None, title='Image')[source]
Bases:
PyQt5.QtWidgets.QToolBarToolbar providing PlotAction suited when displaying curves
- Parameters
parent – See
QWidgetplot (silx.gui.plot.PlotWidget) – PlotWidget to control
title (str) – Title of the toolbar.
- getXAxisLogarithmicAction()[source]
Returns the QAction to toggle X axis log/linear scale.
- Return type
- getYAxisLogarithmicAction()[source]
Returns the QAction to toggle Y axis log/linear scale.
- Return type
ScatterToolBar class
- class ScatterToolBar(parent=None, plot=None, title='Scatter Tools')[source]
Bases:
PyQt5.QtWidgets.QToolBarToolbar providing PlotAction suited when displaying scatter plot
- Parameters
parent – See
QWidgetplot (silx.gui.plot.PlotWidget) – PlotWidget to control
title (str) – Title of the toolbar.
- getXAxisLogarithmicAction()[source]
Returns the QAction to toggle X axis log/linear scale.
- Return type
- getYAxisLogarithmicAction()[source]
Returns the QAction to toggle Y axis log/linear scale.
- Return type
- getKeepDataAspectRatioButton()[source]
Returns the QToolButton controlling data aspect ratio.
- Return type
QToolButton
CurveLegendsWidget
This module provides a widget to display PlotWidget curve legends.
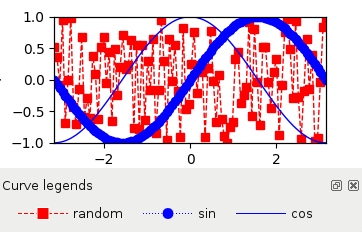
- class CurveLegendsWidget(parent=None)[source]
Bases:
PyQt5.QtWidgets.QWidgetWidget displaying curves legends in a plot
- Parameters
parent (QWidget) – See
QWidget
- sigCurveClicked
Signal emitted when the legend of a curve is clicked
It provides the corresponding curve.
- setPlotWidget(plot)[source]
Set the associated
PlotWidget- Parameters
plot (PlotWidget) – Plot widget to attach
roi: Region of interest
This module provides ROI interaction for PlotWidget.
RegionOfInterestManager class
- class RegionOfInterestManager(parent)[source]
Class handling ROI interaction on a PlotWidget.
It supports the multiple ROIs: points, rectangles, polygons, lines, horizontal and vertical lines.
See
plotInteractiveImageROI.pysample code (Sample Code).- Parameters
parent (silx.gui.plot.PlotWidget) – The plot widget in which to control the ROIs.
- sigRoiAdded
Signal emitted when a new ROI has been added.
It provides the newly add
RegionOfInterestobject.
- sigRoiAboutToBeRemoved
Signal emitted just before a ROI is removed.
It provides the
RegionOfInterestobject that is about to be removed.
- sigRoiChanged
Signal emitted whenever the ROIs have changed.
- sigCurrentRoiChanged
Signal emitted whenever a ROI is selected.
- sigInteractiveModeStarted
Signal emitted when switching to ROI drawing interactive mode.
It provides the class of the ROI which will be created by the interactive mode.
- sigInteractiveRoiCreated
Signal emitted when a ROI is created during the interaction. The interaction is still incomplete and can be aborted.
It provides the ROI object which was just been created.
- sigInteractiveRoiFinalized
Signal emitted when a ROI creation is complet.
It provides the ROI object which was just been created.
- sigInteractiveModeFinished
Signal emitted when leaving interactive ROI drawing mode.
- classmethod getSupportedRoiClasses()[source]
Returns the default available ROI classes
- Return type
List[class]
- getInteractionModeAction(roiClass)[source]
Returns the QAction corresponding to a kind of ROI
The QAction allows to enable the corresponding drawing interactive mode.
- Parameters
roiClass (class) – The ROI class which will be created by this action.
- Return type
QAction
- Raises
ValueError – If kind is not supported
- setCurrentRoi(roi)[source]
Set the currently selected ROI, and emit a signal.
- Parameters
roi (Union[RegionOfInterest,None]) – The ROI to select
- getCurrentRoi()[source]
Returns the currently selected ROI, else None.
- Return type
Union[RegionOfInterest,None]
- getRois()[source]
Returns the list of ROIs.
It returns an empty tuple if there is currently no ROI.
- Returns
Tuple of arrays of objects describing the ROIs
- Return type
List[RegionOfInterest]
- containsRoi(roi)[source]
Returns true if the ROI is part of this manager.
- Parameters
roi (roi_items.RegionOfInterest) – The ROI to add
- Return type
bool
- addRoi(roi, index=None, useManagerColor=True)[source]
Add the ROI to the list of ROIs.
- Parameters
roi (roi_items.RegionOfInterest) – The ROI to add
index (int) – The position where to insert the ROI, By default it is appended to the end of the list of ROIs
useManagerColor (bool) – Whether to set the ROI color to the default one of the manager or not. (Default: True).
- Raises
RuntimeError – When ROI cannot be added because the maximum number of ROIs has been reached.
- removeRoi(roi)[source]
Remove a ROI from the list of ROIs.
- Parameters
roi (roi_items.RegionOfInterest) – The ROI to remove
- Raises
ValueError – When ROI does not belong to this object
- setColor(color)[source]
Set the default color to use when creating ROIs.
Existing ROIs are not affected.
- Parameters
color – The color to use for displaying ROIs as either a color name, a QColor, a list of uint8 or float in [0, 1].
- getCurrentInteractionModeRoiClass()[source]
Returns the current ROI class used by the interactive drawing mode.
Returns None if the ROI manager is not in an interactive mode.
- Return type
Union[class,None]
- getInteractionSource()[source]
Returns the object which have requested the ROI creation.
Returns None if the ROI manager is not in an interactive mode.
- Return type
Union[object,None]
- start(roiClass, source=None)[source]
Start an interactive ROI drawing mode.
- Parameters
roiClass (class) – The ROI class to create. It have to inherite from roi_items.RegionOfInterest.
source (object) – SOurce of the ROI interaction.
- Returns
True if interactive ROI drawing was started, False otherwise
- Return type
bool
- Raises
ValueError – If roiClass is not supported
- stop()[source]
Stop interactive ROI drawing mode.
- Returns
True if an interactive ROI drawing mode was actually stopped
- Return type
bool
InteractiveRegionOfInterestManager class
- class InteractiveRegionOfInterestManager(parent)[source]
RegionOfInterestManager with features for use from interpreter.
It is meant to be used through the
exec(). It provides some messages to display in a status bar and different modes to end blocking calls toexec().- Parameters
parent – See QObject
- sigMessageChanged
Signal emitted when a new message should be displayed to the user
It provides the message as a str.
- getMaxRois()[source]
Returns the maximum number of ROIs or None if no limit.
- Return type
Union[int,None]
- setMaxRois(max_)[source]
Set the maximum number of ROIs.
- Parameters
max (Union[int,None]) – The max limit or None for no limit.
- Raises
ValueError – If there is more ROIs than max value
- class ValidationMode(value)[source]
Mode of validation to leave blocking
exec()- AUTO = 'auto'
Automatically ends the interactive mode once the user terminates the last ROI shape.
- ENTER = 'enter'
Ends the interactive mode when the Enter key is pressed.
- AUTO_ENTER = 'auto_enter'
Ends the interactive mode when reaching max ROIs or when the Enter key is pressed.
- NONE = 'none'
Do not provide the user a way to end the interactive mode.
The end of
exec()is done throughquit()or timeout.
- setValidationMode(mode)[source]
Set the way to perform interactive mode validation.
See
ValidationModeenumeration for the supported validation modes.- Parameters
mode (ValidationMode) – The interactive mode validation to use.
- getMessage()[source]
Returns the current status message.
This message is meant to be displayed in a status bar.
- Return type
str
- exec(roiClass, timeout=0)[source]
Block until ROI selection is done or timeout is elapsed.
quit()also ends this blocking call.- Parameters
roiClass (class) – The class of the ROI which have to be created. See silx.gui.plot.items.roi.
timeout (int) – Maximum duration in seconds to block. Default: No timeout
- Returns
The list of ROIs
- Return type
List[RegionOfInterest]
RegionOfInterestTableWidget class
- class RegionOfInterestTableWidget(parent=None)[source]
Widget displaying the ROIs of a
RegionOfInterestManager- setRegionOfInterestManager(manager)[source]
Set the
RegionOfInterestManagerobject to sync with- Parameters
manager (RegionOfInterestManager) –
- getRegionOfInterestManager()[source]
Returns the
RegionOfInterestManagerthis widget supervise.It returns None if not sync with an
RegionOfInterestManager.- Return type
ColorBar: ColorBar Widget
Module containing several widgets associated to a colormap.
ColorBarWidget class
- class ColorBarWidget(parent=None, plot=None, legend=None)[source]
Colorbar widget displaying a colormap
It uses a description of colormap as dict compatible with
Plot.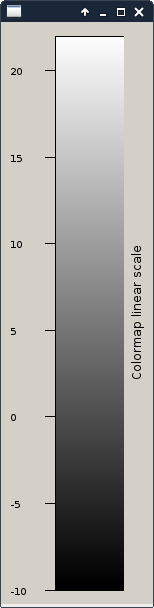
To run the following sample code, a QApplication must be initialized.
>>> from silx.gui.plot import Plot2D
>>> from silx.gui.plot.ColorBar import ColorBarWidget
>>> plot = Plot2D()  # Create a plot widget
>>> plot.show()
>>> colorbar = ColorBarWidget(plot=plot, legend='Colormap')  # Associate the colorbar with it
>>> colorbar.show()
Initializer parameters:
- Parameters
parent – See
QWidgetplot – PlotWidget the colorbar is attached to (optional)
legend (str) – the label to set to the colorbar
- sigVisibleChanged
Emitted when the property visible have changed.
- setPlot(plot)[source]
Associate a plot to the ColorBar
- Parameters
plot – the plot to associate with the colorbar. If None will remove any connection with a previous plot.
- setColormap(colormap, data=None)[source]
Set the colormap to be displayed.
- Parameters
colormap (Colormap) – The colormap to apply on the ColorBarWidget
data (Union[numpy.ndarray,ColormapMixin]) – The data to display or item, needed if the colormap require an autoscale
- setLegend(legend)[source]
Set the legend displayed along the colorbar
- Parameters
legend (str) – The label