RangeSlider: Slider to define an interval
This module provides a RangeSlider widget.
-
class
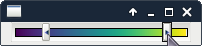
RangeSlider(parent=None)[source]¶ Range slider with 2 thumbs and an optional colored groove.
The position of the slider thumbs can be retrieved either as values in the slider range or as a number of steps or pixels.
Parameters: parent (QWidget) – See QWidget -
sigRangeChanged= <PySide2.QtCore.Signal object>¶ Signal emitted when the value range has changed.
It provides the new range (min, max).
-
sigValueChanged= <PySide2.QtCore.Signal object>¶ Signal emitted when the value of the sliders has changed.
It provides the slider values (first, second).
-
sigPositionCountChanged= <PySide2.QtCore.Signal object>¶ This signal is emitted when the number of steps has changed.
It provides the new position count.
-
sigPositionChanged= <PySide2.QtCore.Signal object>¶ Signal emitted when the position of the sliders has changed.
It provides the slider positions in steps or pixels (first, second).
-
setPositionCount(count)[source]¶ Set the number of positions.
Slider values are eventually adjusted.
Parameters: count (Union[int,None]) – Either the number of possible positions or None to allow any values. Raises: ValueError – If count <= 1
-
setFirstPosition(position)[source]¶ Set the position of the first slider
The position is adjusted to valid values
Parameters: position (int) –
-
setSecondPosition(position)[source]¶ Set the position of the second slider
The position is adjusted to valid values
Parameters: position (int) –
-
setPositions(first, second)[source]¶ Set the position of both sliders at once
First is clipped to the slider range: [0, max]. Second is clipped to valid values: [first, max]
Parameters: - first (int) –
- second (int) –
-
setMinimum(minimum)[source]¶ Set the minimum value of the slider range.
It eventually adjusts maximum. Slider positions remains unchanged and slider values are modified.
Parameters: minimum (float) –
-
setMaximum(maximum)[source]¶ Set the maximum value of the slider range
It eventually adjusts minimum. Slider positions remains unchanged and slider values are modified.
Parameters: maximum (float) –
-
setRange(minimum, maximum)[source]¶ Set the range of values.
If maximum is lower than minimum, minimum is the only valid value. Slider positions remains unchanged and slider values are modified.
Parameters: - minimum (float) –
- maximum (float) –
-
setFirstValue(value)[source]¶ Set the value of the first slider
Value is clipped to valid values.
Parameters: value (float) –
-
setSecondValue(value)[source]¶ Set the value of the second slider
Value is clipped to valid values.
Parameters: value (float) –
-
getValues()[source]¶ Returns value of both sliders at once
Returns: (first value, second value) Return type: List[float]
-
setValues(first, second)[source]¶ Set values for both sliders at once
First is clipped to the slider range: [minimum, maximum]. Second is clipped to valid values: [first, maximum]
Parameters: - first (float) –
- second (float) –
-
getGroovePixmap()[source]¶ Returns the pixmap displayed in the slider groove if any.
Return type: Union[QPixmap,None]
-
setGroovePixmap(pixmap)[source]¶ Set the pixmap displayed in the slider groove.
Parameters: pixmap (Union[QPixmap,None]) – The QPixmap to use or None to unset.
-
setGroovePixmapFromProfile(profile, colormap=None)[source]¶ Set the pixmap displayed in the slider groove from histogram values.
Parameters: - profile (Union[numpy.ndarray,None]) – 1D array of values to display
- colormap (Union[Colormap,str]) – The colormap name or object to convert profile values to colors
-