CurvesROIWidget: ROI from curves
You can access to the ROIWidget from a Plot window by :
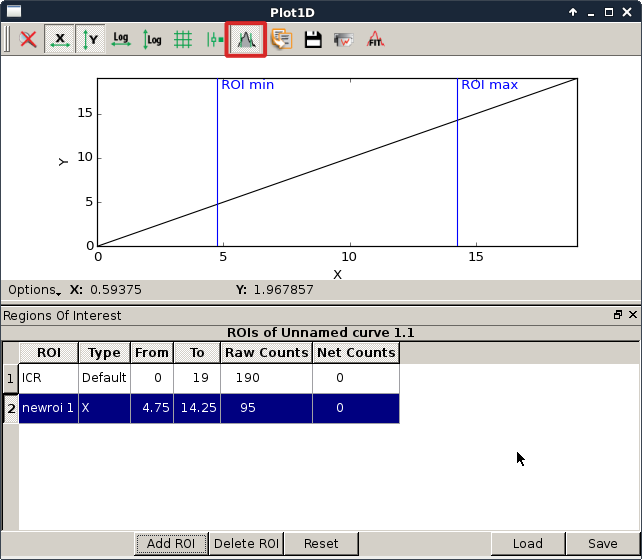
- using the tool button ‘ROI’
- using the options button then by selecting region of interest.
Widget to handle regions of interest (ROI) on curves displayed in a PlotWindow.
This widget is meant to work with PlotWindow.
ROI are defined by :
A name (ROI column)
A type. The type is the label of the x axis. This can be used to apply or not some ROI to a curve and do some post processing.
The x coordinate of the left limit (from column)
The x coordinate of the right limit (to column)
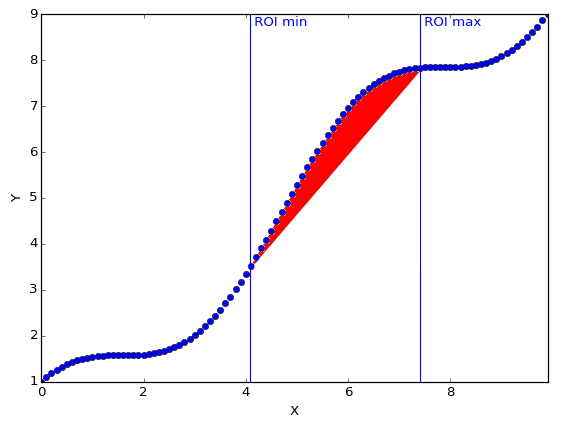
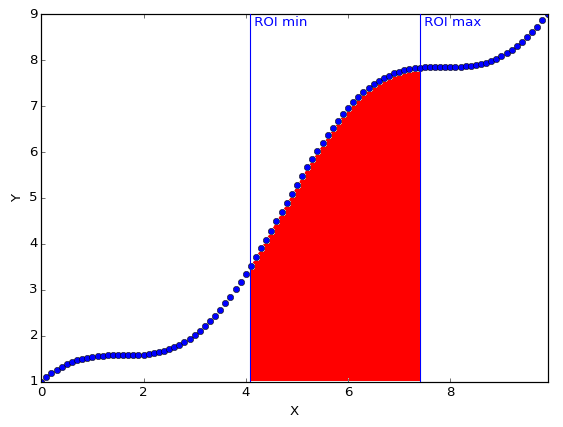
Raw counts: Sum of the curve’s values in the defined Region Of Intereset.
Net counts: Raw counts minus background