ComplexImageView: Plot a 2D array of complex
This module provides a widget to view 2D complex data.
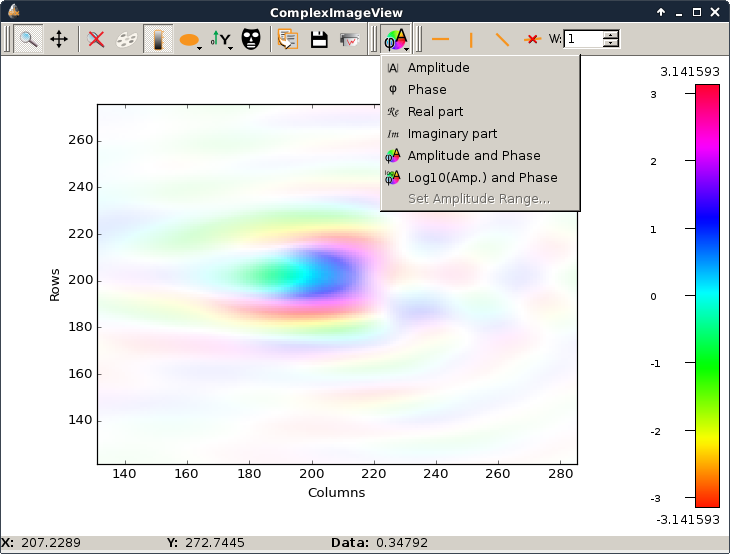
The ComplexImageView widget is dedicated to visualize a single 2D dataset
of complex data.
ComplexImageView class
-
class
ComplexImageView(parent=None)[source]¶ Display an image of complex data and allow to choose the visualization.
Parameters: parent – See QMainWindow-
class
Mode¶ Identify available display mode for complex
-
sigDataChanged= <PySide2.QtCore.Signal object>¶ Signal emitted when data has changed.
-
sigVisualizationModeChanged= <PySide2.QtCore.Signal object>¶ Signal emitted when the visualization mode has changed.
It provides the new visualization mode.
-
setData(data=None, copy=True)[source]¶ Set the complex data to display.
Parameters: - data (numpy.ndarray) – 2D complex data
- copy (bool) – True (default) to copy the data, False to use provided data (do not modify!).
-
getData(copy=True)[source]¶ Get the currently displayed complex data.
Parameters: copy (bool) – True (default) to return a copy of the data, False to return internal data (do not modify!). Returns: The complex data array. Return type: numpy.ndarray of complex with 2 dimensions
-
getDisplayedData(copy=True)[source]¶ Returns the displayed data depending on the visualization mode
WARNING: The returned data can be a uint8 RGBA image
Parameters: copy (bool) – True (default) to return a copy of the data, False to return internal data (do not modify!) Return type: numpy.ndarray of float with 2 dims or RGBA image (uint8)
-
static
getSupportedVisualizationModes()[source]¶ Returns the supported visualization modes.
Supported visualization modes are:
- amplitude: The absolute value provided by numpy.absolute
- phase: The phase (or argument) provided by numpy.angle
- real: Real part
- imaginary: Imaginary part
- amplitude_phase: Color-coded phase with amplitude as alpha.
- log10_amplitude_phase: Color-coded phase with log10(amplitude) as alpha.
Return type: tuple of str
-
setVisualizationMode(mode)[source]¶ Set the mode of visualization of the complex data.
See
getSupportedVisualizationModes()for the list of supported modes.Parameters: mode (str) – The mode to use.
-
getVisualizationMode()[source]¶ Get the current visualization mode of the complex data.
Return type: Mode
-
setColormap(colormap, mode=None)[source]¶ Set the colormap to use for amplitude, phase, real or imaginary.
WARNING: This colormap is not used when displaying both amplitude and phase.
Parameters:
-
getColormap(mode=None)[source]¶ Returns the colormap used to display the data.
Parameters: mode (Mode) – If specified, set the colormap of this specific mode Return type: Colormap
-
getOrigin()[source]¶ Returns the offset from origin at which to display the image.
Return type: 2-tuple of float
-
setOrigin(origin)[source]¶ Set the offset from origin at which to display the image.
Parameters: origin (float or 2-tuple of float) – (ox, oy) Offset from origin
-
getScale()[source]¶ Returns the scale of the image in data coordinates.
Return type: 2-tuple of float
-
setScale(scale)[source]¶ Set the scale of the image
Parameters: scale (float or 2-tuple of float) – (sx, sy) Scale of the image
-
getXAxis()[source]¶ Returns the X axis
Return type: items.Axis
-
getYAxis()[source]¶ Returns an Y axis
Return type: items.Axis
-
setGraphTitle(title='')[source]¶ Set the plot main title.
Parameters: title (str) – Main title of the plot (default: ‘’)
-
class