DataViewer: Widget to display any kind of data
This module defines a widget designed to display data using to most adapted view from available ones from silx.
- class silx.gui.data.DataViewer.DataViewer(parent=None)[source]
Widget to display any kind of data
The method setData() allows to set any data to the widget. Mostly numpy.array and h5py.Dataset are supported with adapted views. Other data types are displayed using a text viewer.
A default view is automatically selected when a data is set. The method setDisplayMode() allows to change the view. To have a graphical tool to select the view, prefer using the widget DataViewerFrame.
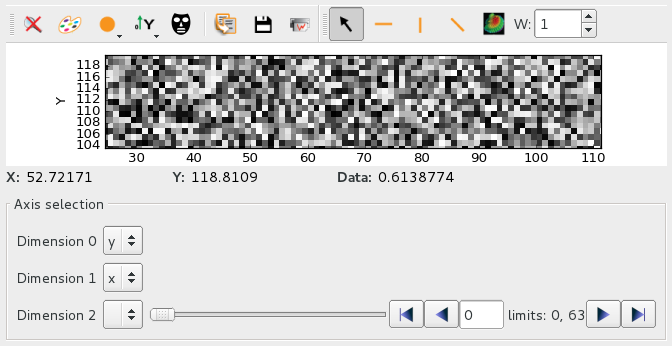
The dimension of the input data and the expected dimension of the selected view can differ. For example you can display an image (2D) from 4D data. In this case a NumpyAxesSelector is displayed to allow the user to select the axis mapping and the slicing of other axes.
import numpy
data = numpy.random.rand(500,500)
viewer = DataViewer()
viewer.setData(data)
viewer.setVisible(True)
- displayedViewChanged
Emitted when the displayed view changes
- dataChanged
Emitted when the data changes
- currentAvailableViewsChanged
Emitted when the current available views (which support the current data) change
- createDefaultViews()[source]
Create and returns available views which can be displayed by default by the data viewer.
Return type: list[DataView]
- normalizeData(data)[source]
Returns a normalized data if the embed a numpy or a dataset. Else returns the data.
- setDisplayedView(view)[source]
Set the displayed view.
Change the displayed view according to the view itself.
Parameters: view (DataView) – The DataView to use to display the data
- getViewFromModeId(modeId)[source]
Returns the first available view which have the requested modeId.
Parameters: modeId (int) – Requested mode id Return type: DataView
- setDisplayMode(modeId)[source]
Set the displayed view using display mode.
Change the displayed view according to the requested mode.
Parameters: modeId (int) – Display mode, one of
- EMPTY_MODE: display nothing
- PLOT1D_MODE: display the data as a curve
- PLOT2D_MODE: display the data as an image
- PLOT3D_MODE: display the data as an image
- RAW_MODE: display the data as a table
- STACK_MODE: display the data as an image
- HDF5_MODE: display the data as an image
- getSafeViewFromAvailableViews(data, available)[source]
Returns a view which is sure to display something without failing on rendering.
Parameters: - data (object) – data which will be displayed
- available (list[view]) – List of available views, from highest priority to lowest.
Return type: DataView
- getDefaultViewFromAvailableViews(data, available)[source]
Returns the default view which will be used according to available views.
Parameters: - data (object) – data which will be displayed
- available (list[view]) – List of available views, from highest priority to lowest.
Return type: DataView
- currentAvailableViews()[source]
Returns the list of available views for the current data
Return type: List[DataView]

Previous topic
DataViewerFrame: Widget to display any kind of data
Next topic
NumpyAxesSelector:Widget to select a view from a numpy array