StatsWidget: Display a set of statictics for plot items
Module containing widgets displaying stats from items of a plot.
StatsWidget class
-
class
StatsWidget(parent=None, plot=None, stats=None)[source]¶ Bases:
PyQt5.QtWidgets.QWidgetWidget displaying a set of
Statto be displayed on aStatsTableand to be apply on items contained in thePlotAlso contains options to:- compute statistics on all the data or on visible data only
- show statistics of all items or only the active one
Parameters: - parent (QWidget) – Qt parent
- plot (Union[PlotWidget,SceneWidget]) – The plot containing items on which we want statistics.
- stats (StatsHandler) – Set the statistics to be displayed and how to format them using
-
sigVisibilityChanged¶ Signal emitted when the visibility of this widget changes.
It Provides the visibility of the widget.
-
setStats(statsHandler)[source]¶ Set which stats to display and the associated formatting.
Parameters: statsHandler (StatsHandler) – Set the statistics to be displayed and how to format them using
-
setPlot(plot)[source]¶ Define the plot to interact with
Parameters: plot (Union[PlotWidget,SceneWidget,None]) – The plot containing the items on which statistics are applied
-
getPlot()[source]¶ Returns the plot attached to this widget
Return type: Union[PlotWidget,SceneWidget,None]
-
setDisplayOnlyActiveItem(displayOnlyActItem)[source]¶ Toggle display off all items or only the active/selected one
Parameters: displayOnlyActItem (bool) – True if we want to only show active item
-
setStatsOnVisibleData(b)[source]¶ Toggle computation of statistics on whole data or only visible ones.
Warning
When visible data is activated we will process to a simple filtering of visible data by the user. The filtering is a simple data sub-sampling. No interpolation is made to fit data to boundaries.
Parameters: b (bool) – True if we want to apply statistics only on visible data
-
getUpdateMode()[source]¶ Returns update mode (See
setUpdateMode()).Returns: update mode Return type: UpdateMode
BasicStatsWidget class
-
class
BasicStatsWidget(parent=None, plot=None)[source]¶ Bases:
silx.gui.plot.StatsWidget.StatsWidgetWidget defining a simple set of
Statto be displayed on aStatsWidget.Parameters: - parent (QWidget) – Qt parent
- plot (PlotWidget) – The plot containing items on which we want statistics.
- stats (StatsHandler) – Set the statistics to be displayed and how to format them using
StatsTable class
-
class
StatsTable(parent=None, plot=None)[source]¶ Bases:
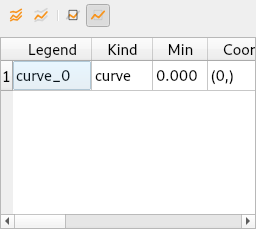
silx.gui.plot.StatsWidget._StatsWidgetBase,silx.gui.widgets.TableWidget.TableWidgetTableWidget displaying for each curves contained by the Plot some information:
- legend
- minimal value
- maximal value
- standard deviation (std)
Parameters: - parent (QWidget) – The widget’s parent.
- plot (Union[PlotWidget,SceneWidget]) –
PlotWidgetorSceneWidgetinstance on which to operate
-
sigUpdateModeChanged¶ Signal emitted when the update mode changed
-
setStats(statsHandler)[source]¶ Set which stats to display and the associated formatting.
Parameters: statsHandler (StatsHandler) – Set the statistics to be displayed and how to format them using
-
setPlot(plot)[source]¶ Define the plot to interact with
Parameters: plot (Union[PlotWidget,SceneWidget,None]) – The plot containing the items on which statistics are applied
BasicLineStatsWidget class
-
class
BasicLineStatsWidget(parent=None, plot=None, kind='curve', stats=<silx.gui.plot.stats.statshandler.StatsHandler object>, statsOnVisibleData=False)[source]¶ Bases:
PyQt5.QtWidgets.QWidgetWidget defining a simple set of
Statto be displayed on aLineStatsWidget.Parameters: - parent (QWidget) – Qt parent
- plot (Union[PlotWidget,SceneWidget]) – The plot containing items on which we want statistics.
- kind (str) – the kind of plotitems we want to display
- stats (StatsHandler) – Set the statistics to be displayed and how to format them using
- statsOnVisibleData (bool) – compute statistics for the whole data or only visible ones.
-
setUpdateMode(mode)[source]¶ Set the way to update the displayed statistics.
Parameters: mode (Union[str,UpdateMode]) – mode requested for update
-
getUpdateMode()[source]¶ Returns update mode (See
setUpdateMode()).Returns: update mode Return type: UpdateMode
-
setPlot(plot)[source]¶ Define the plot to interact with
Parameters: plot (Union[PlotWidget,SceneWidget,None]) – The plot containing the items on which statistics are applied
-
setStats(statsHandler)[source]¶ Set which stats to display and the associated formatting.
Parameters: statsHandler (StatsHandler) – Set the statistics to be displayed and how to format them using
-
setKind(kind)[source]¶ Change the kind of active item to display :param str kind: kind of item to display information for (‘curve’ ...)
-
setStatsOnVisibleData(b)[source]¶ Toggle computation of statistics on whole data or only visible ones.
Warning
When visible data is activated we will process to a simple filtering of visible data by the user. The filtering is a simple data sub-sampling. No interpolation is made to fit data to boundaries.
Parameters: b (bool) – True if we want to apply statistics only on visible data
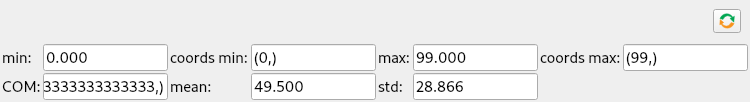
BasicGridStatsWidget class
-
class
BasicGridStatsWidget(parent=None, plot=None, kind='curve', stats=<silx.gui.plot.stats.statshandler.StatsHandler object>, statsOnVisibleData=False)[source]¶ Bases:
PyQt5.QtWidgets.QWidgetpymca design like widget
Parameters: - parent (QWidget) – Qt parent
- plot (Union[PlotWidget,SceneWidget]) – The plot containing items on which we want statistics.
- stats (StatsHandler) – Set the statistics to be displayed and how to format them using
- kind (str) – the kind of plotitems we want to display
- statsOnVisibleData (bool) – compute statistics for the whole data or only visible ones.
- statsPerLine (int) – number of statistic to be displayed per line
-
setUpdateMode(mode)[source]¶ Set the way to update the displayed statistics.
Parameters: mode (Union[str,UpdateMode]) – mode requested for update
-
getUpdateMode()[source]¶ Returns update mode (See
setUpdateMode()).Returns: update mode Return type: UpdateMode
-
setPlot(plot)[source]¶ Define the plot to interact with
Parameters: plot (Union[PlotWidget,SceneWidget,None]) – The plot containing the items on which statistics are applied
-
setStats(statsHandler)[source]¶ Set which stats to display and the associated formatting.
Parameters: statsHandler (StatsHandler) – Set the statistics to be displayed and how to format them using
-
setKind(kind)[source]¶ Change the kind of active item to display :param str kind: kind of item to display information for (‘curve’ ...)
-
setStatsOnVisibleData(b)[source]¶ Toggle computation of statistics on whole data or only visible ones.
Warning
When visible data is activated we will process to a simple filtering of visible data by the user. The filtering is a simple data sub-sampling. No interpolation is made to fit data to boundaries.
Parameters: b (bool) – True if we want to apply statistics only on visible data